Statistics
- Kim Rasmussen
- Kim Rasmussen (Unlicensed)
- Patrick Ahmed (Unlicensed)
Ceptor has quite elaborate statistics available.
Statistics are gathered by all components, and sent to the Ceptor Statistics Server for safekeeping. The servers / components themselves keep a copy of the total values, but discard the detailed measurements as soon as they are sent to keep memory usage as low as possible.
Statistics data can be presented in tables in Server Overview for all available servers, within Server Status for each server, or you can create Dashboards where you can show any number of charts that are continually updated and can show e.g. server traffic, memory usage, or number of logins / sessions, database performance or anything else.
You can also browse through the History of all measurement points for all servers, or you can define your own PDF reports templates, and generate reports from then whenever you like.
History
From the Ceptor Console menu, select "History" to view the historical statistics - the console will then fetch the data from the Ceptor Statistics Server and display them.
This will give you a page like this, where you can browse through all the recorded statistics and filter it by entering values in "Server Filter" or "Function Filter".
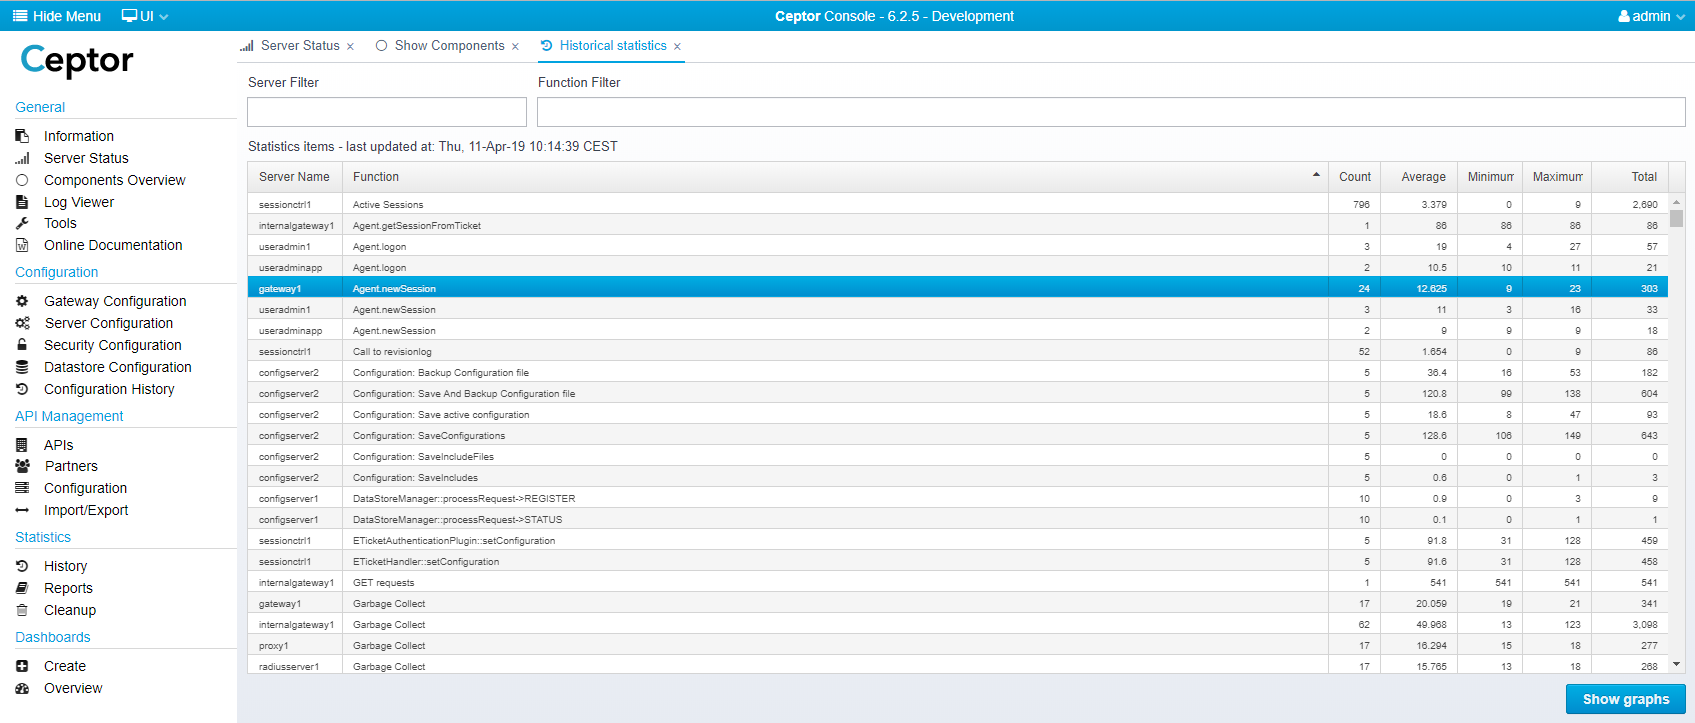
If you want to view a graph of the measurements made, select a line and press "Show Graphs" - you will then get this dialog:
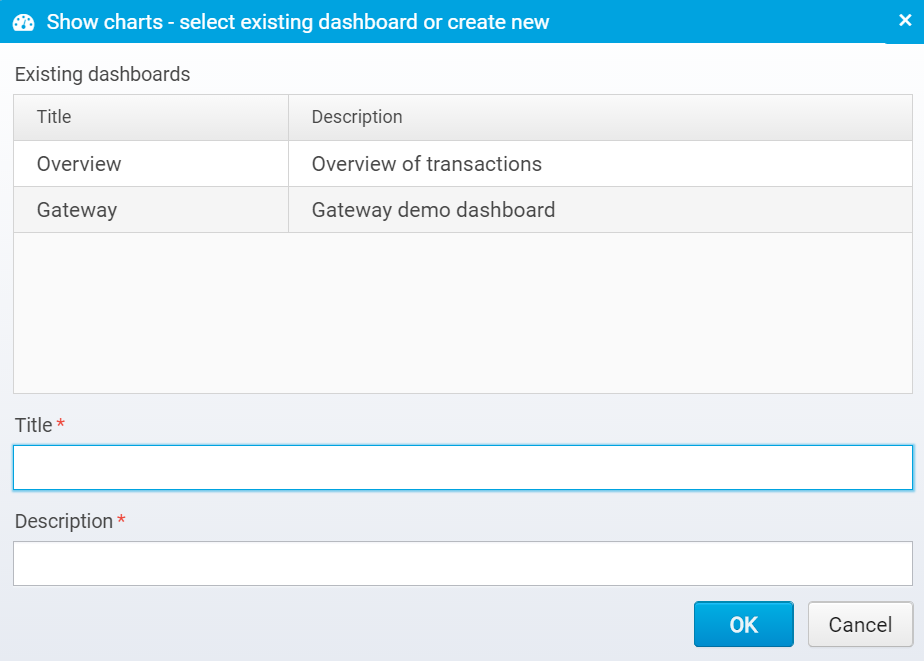
Here, you either select an existing dashboard to show the graphs/charts in or create a new one.
See Dashboards for more information on what you can do with the charts there.
Reports
If you select "Reports" from the statistics menu, you get to this screen:
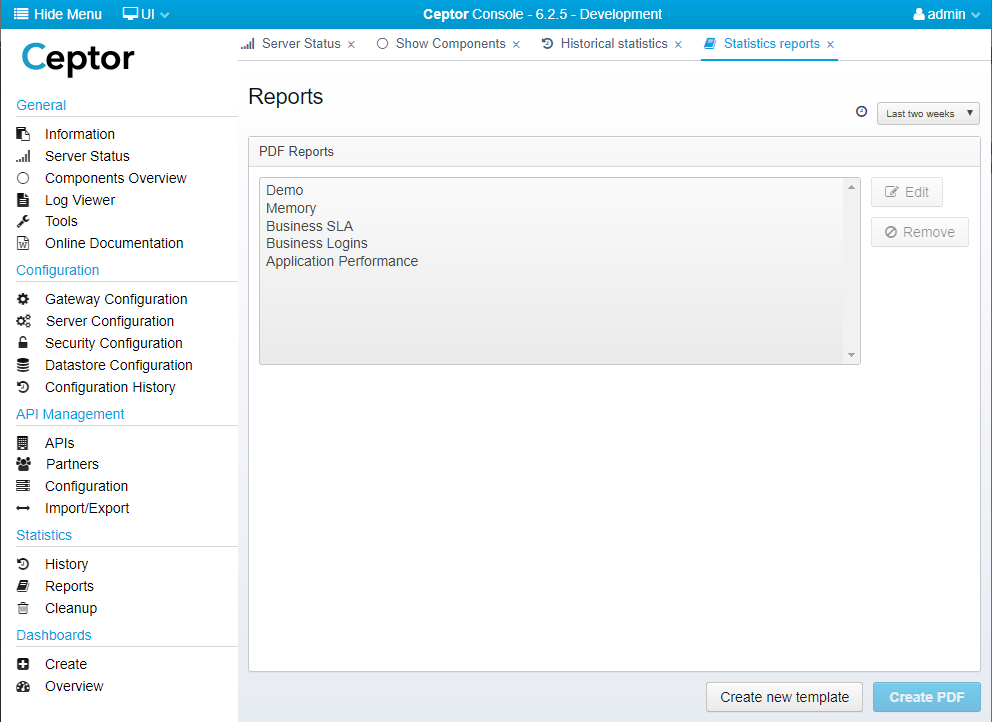
Here, you can select an existing template, and create a PDF from it - select the time interval you want up in the top right corner.
You can use an existing template, or create a new one, you can also edit an existing template:
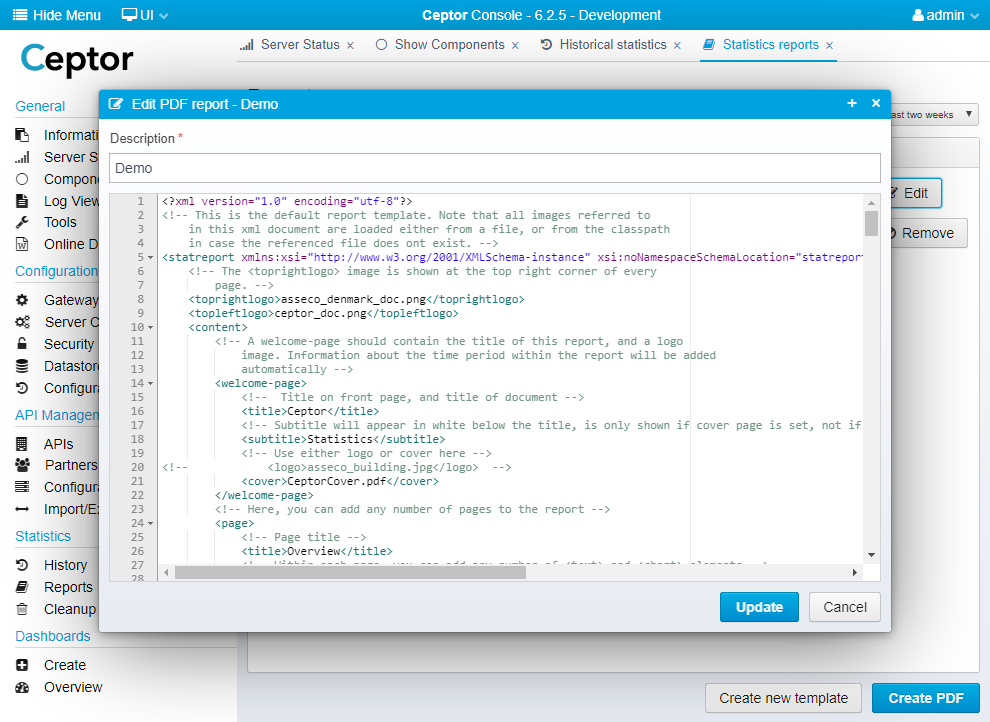
The template contains information about what pages to include in the report, and what data to extract from the statistics and display in it. You can add text, charts, markdown and images and in general customize the report with the content you need. Once you have a template, you can use it to generate reports for various audiences, such as technical personal with information about response times, or you can target business with reports containing information about the number of users, various login methods, uses of different applications etc.
Please look at Creating PDF Reports for detailed information about the templates, and how to modify them.
Cleanup
Over the years, your statistics can become dirty and need a cleanup. if you select "Cleanup" from the Statistics menu, you get this screen:
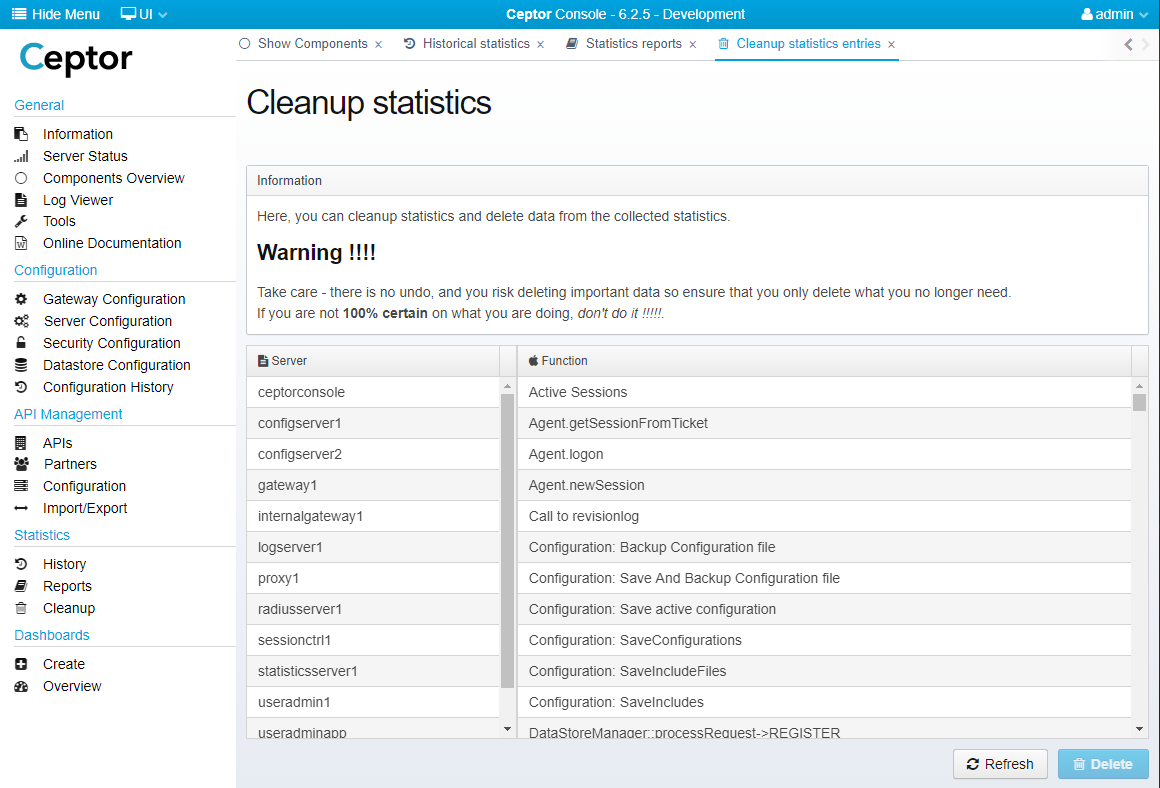
Here, you can remove obsolete statistics entries, e.g. for servers that no longer exists, or functions that are obsolete.
Select the servers and functions you want to get rid of, and click Delete. Make sure you really want to delete this information before you do so, since it cannot be recovered, except by stopping the statistics server and replacing its data file with a backup, and then restarting it - by doing this, you will lose the statistics collected since the backup was taken.
Related content
© Ceptor ApS. All Rights Reserved.