Components Overview
- Kim Rasmussen
- Kim Rasmussen (Unlicensed)
- Patrick Ahmed (Unlicensed)
The components overview allows you to see a graphical overview of running components, and see which components are connected to other components.
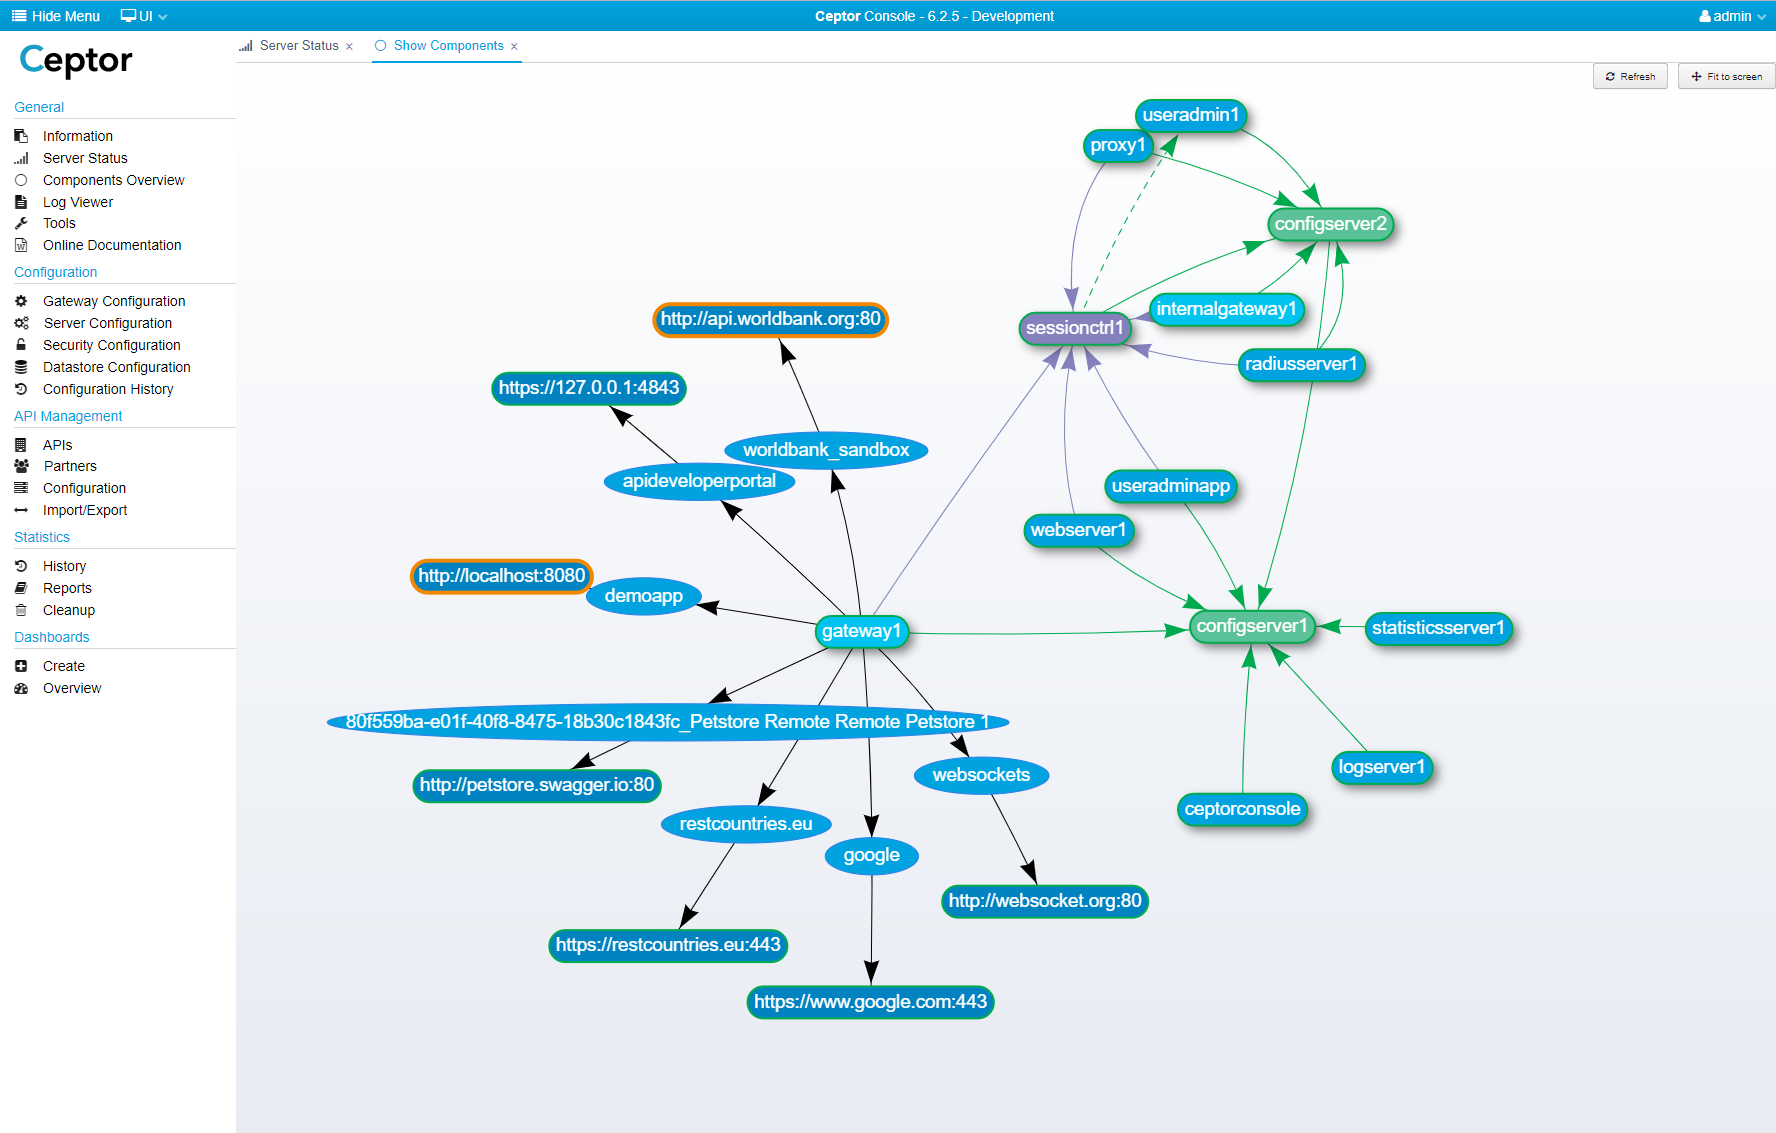
The diagram is interactive, so you can drag the individual components around. It is also continually updated so any changes are visible and hilited.
Contents
Within this graphical overview, you can get a quick overview of server components, specifically:
- Applications running with agents and their connections to configuration servers, session controllers and useradmin servers.
- For gateways, you can see their destinations and the status of targets in each destination.
- You can drag components around, zoom in/out using the mouse, or click specific servers to view their status.
- The border around a component reflects its status - it can be green if the component is started, red if stopped and orange if it is starting/stopping etc.
- If the border around a target server is orange, it means that ping / connection failed to it, and it will show red if the server is disabled and users do not have access to it. The green border around a target server means that ping succeeds.
You can place the mouse over a specific server to view details about what failed, e.g. why did the ping request towards it fail.
The graph updates every 15 seconds, and animates any changes so it is easy to notice changes as they happen, e.g. if an agent changes connection to another server in the cluster, or if a target server fails and stops responding to ping requests.
Note that you can also add this view to a dashboard so you can create a custom dashboard to show various important statistics as well as the over.
Related content
© Ceptor ApS. All Rights Reserved.