API Usage / Analytics
Setting up API Usage
You should refer to the documentation about setting up API Usage Reporters within the Gateway here: Setting up API Gateway - here, we assume that you have configured the Ceptor Gateway to use Elasticsearch.
When Is API Usage Information Recorded
For API Usage information to be recorded, the gateway needs to be set up to store the information - e.g. within Elasticsearch.
Once this is configured, all API calls will be recorded by the API Usage plugin. If an API requires subscription, or if an API Partner is authenticated in another way, e.g. via specific authentication requirement configured in the gateway, the API Usage information will contain details about who made the call.
If the call itself resulted in an error - e.g. if the number of calls by a specific API Partner Application exceeded the allowed maximum, or if all configured backend servers for an API were down, then this information will be available in the API Usage record as well.
See Setting up API Gateway for more details.
Viewing API Usage / Analytics Information Within Ceptor Console
There are various methods of viewing API Usage information within Ceptor Console - the following assumes that Ceptor API Gateway is configured to use Elasticsearch to store API Usage information.
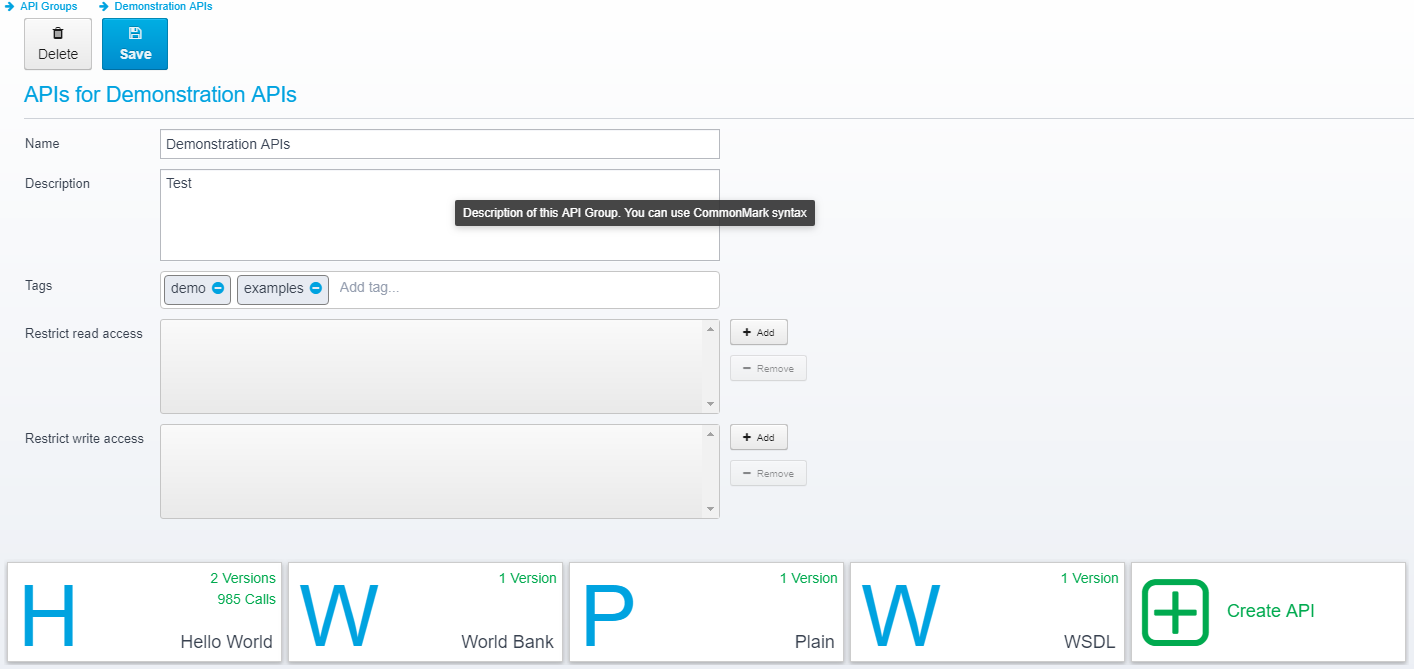
When viewing the APIs within an API Group, you can see how many times each API has been called right from the overview, like this example:
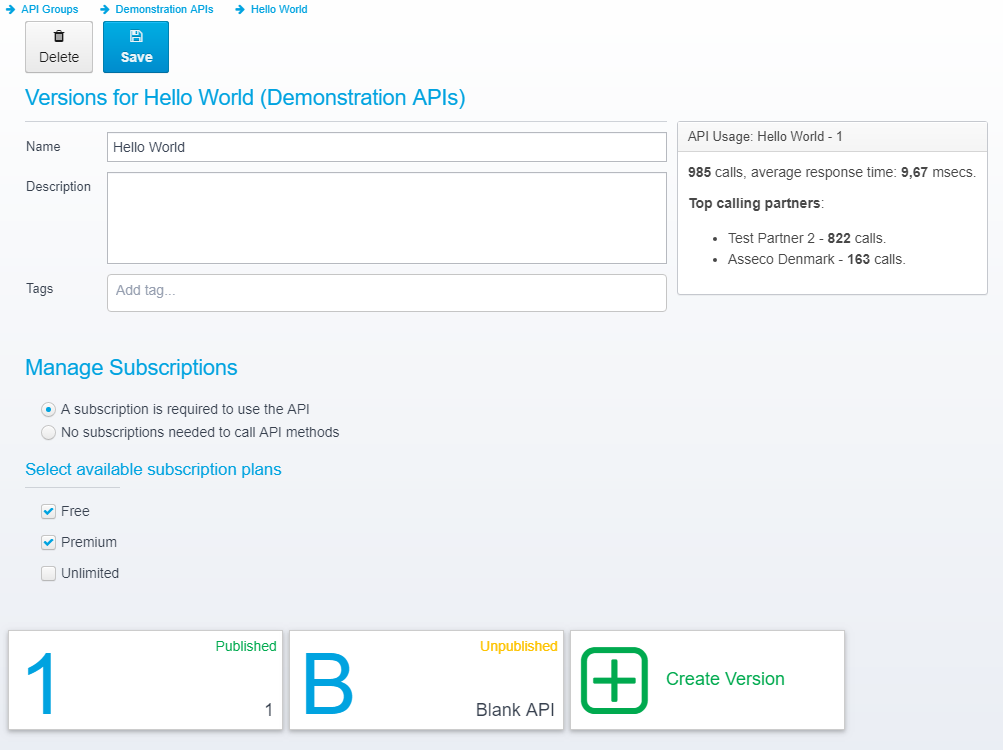
Once you select an API, you will get information about each API Version within it - here, you can see the top 10 list of calling partners as well as the current number of calls and average response time.
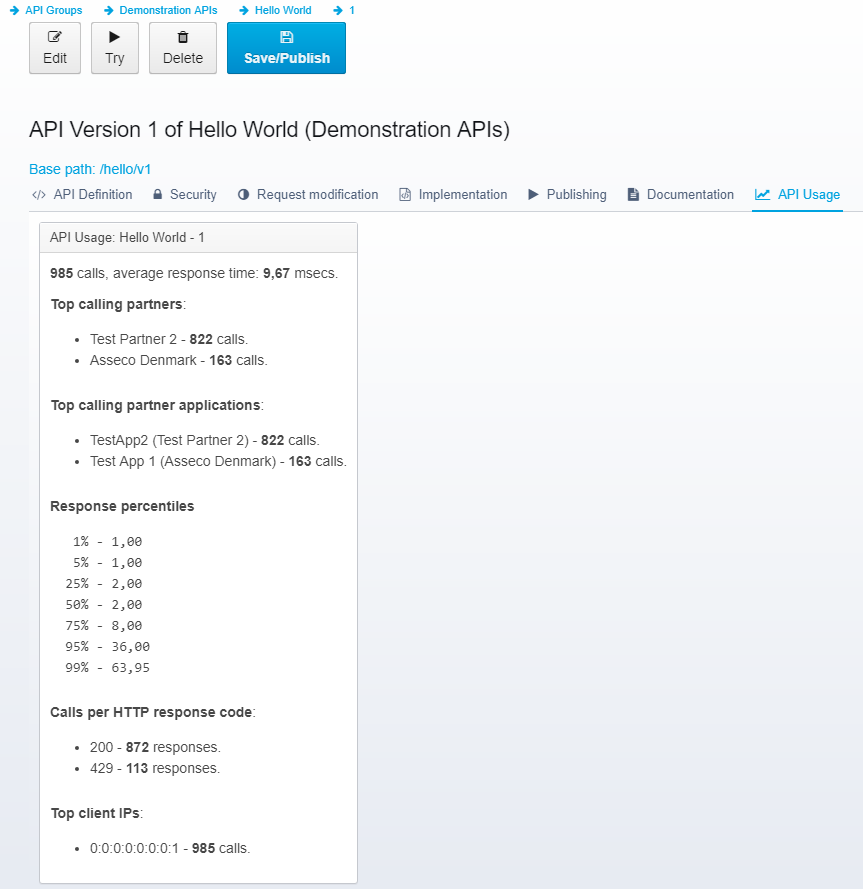
When you select a single API, you get much more detail about the usage of the API, in addition to the averages and the list of calling partners, you can also see the top calling applications, and you can view response percentiles, meaning the percentage of responses that have been completed within a given time - this tells you what experience is for most the your clients.
You will also see how which HTTP response codes were sent in how many calls (the top 10 list is displayed) and you can see which clients made the calls.
Viewing Elasticsearch Data in Dashboards
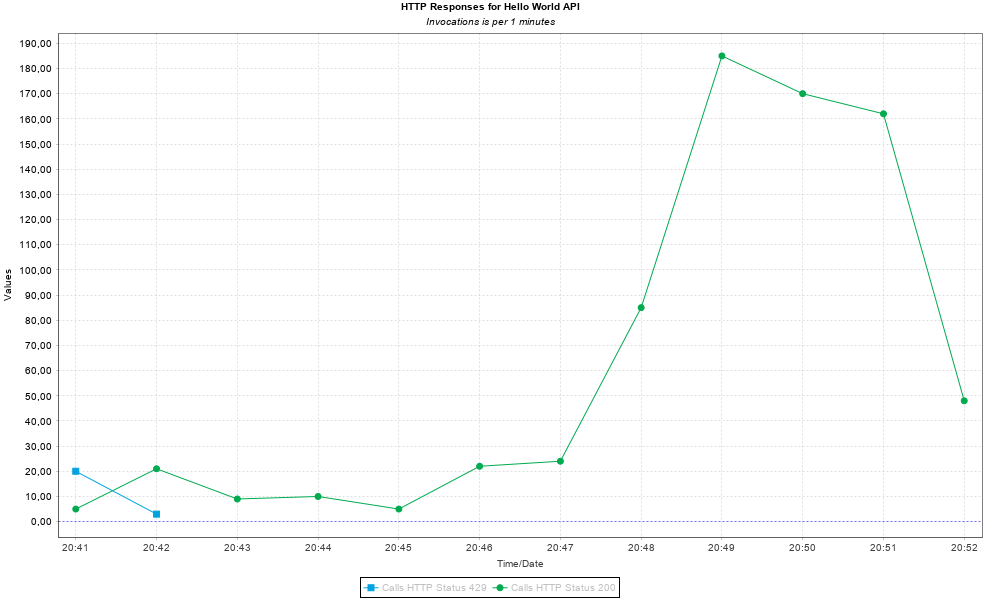
If you need to do deeper analysis of your API calls, you can now use Elasticsearch as a datasource when defining Dashboards within Ceptor Console.
This allows you to create charts like these:
and
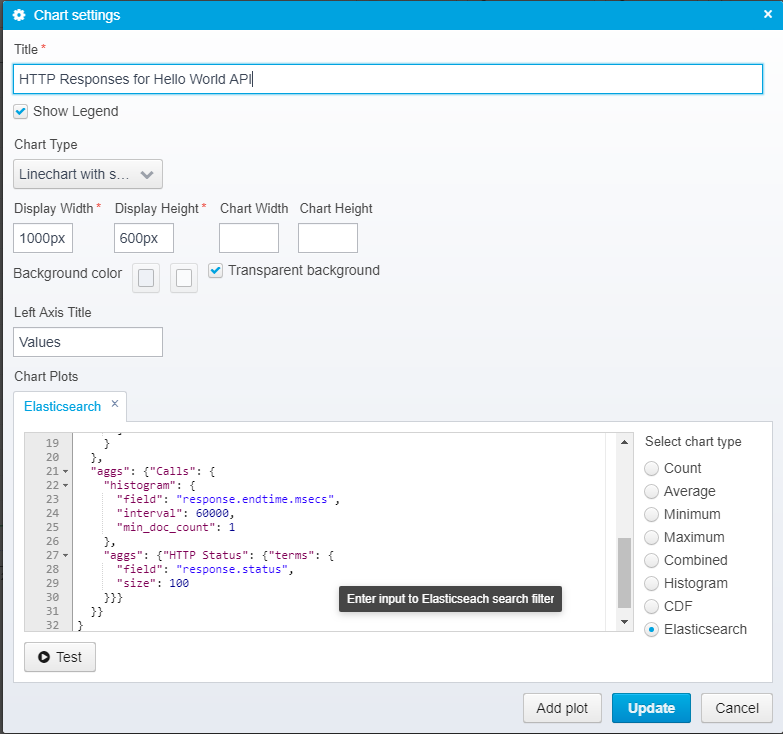
For advanced users, you can fully customize Elasticsearch search queries, like this:
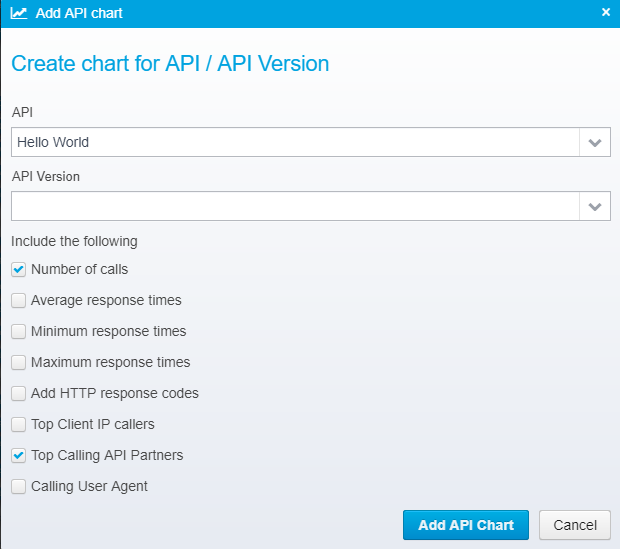
and to help you create those queries, Ceptor Console can create ones for you, which you can later modify yourself
As an example, using the input above, a query like this is generated:
{
  "query": {"bool": {
    "must": [{"match": {"api.id": "3fe3ac57-c2da-4ce2-a2bc-25202f62c88b"}}],
    "filter": {"range": {"response.endtime.msecs": {
      "gte": 0,
      "lte": 999999999999999999
    }}}
  }},
  "aggs": {"API": {
    "histogram": {
      "field": "response.endtime.msecs",
      "interval": 60000,
      "min_doc_count": 1
    },
    "aggs": {
      "Calls": {"value_count": {"field": "response.endtime.msecs"}},
      "Partner": {"terms": {
        "field": "apipartner.name.keyword",
        "size": 100
      }}
    }
  }}
}
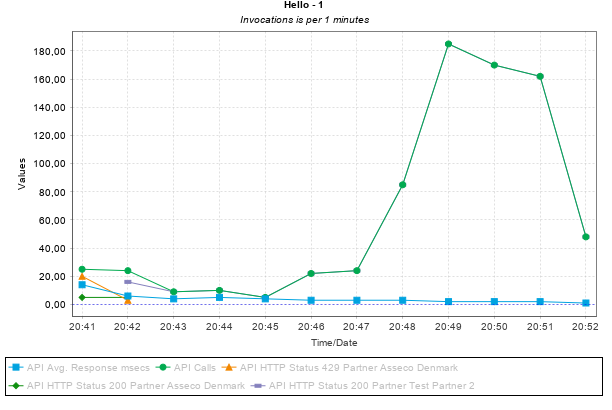
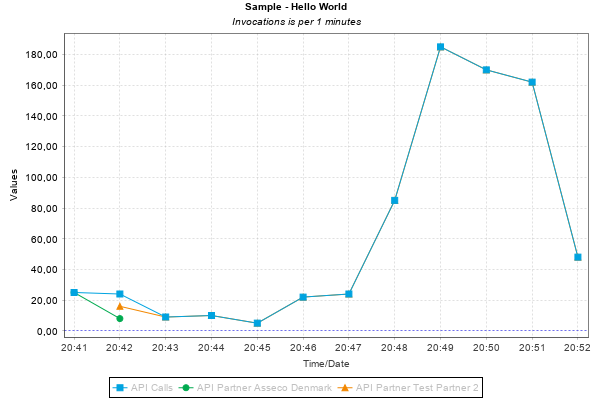
Ceptor dynamically modifies the range filter and histogram interval when generating the chart to match the selected time period for which a chart is generated.
Resulting in the chart below.
Viewing API Usage in Ceptor Statistics
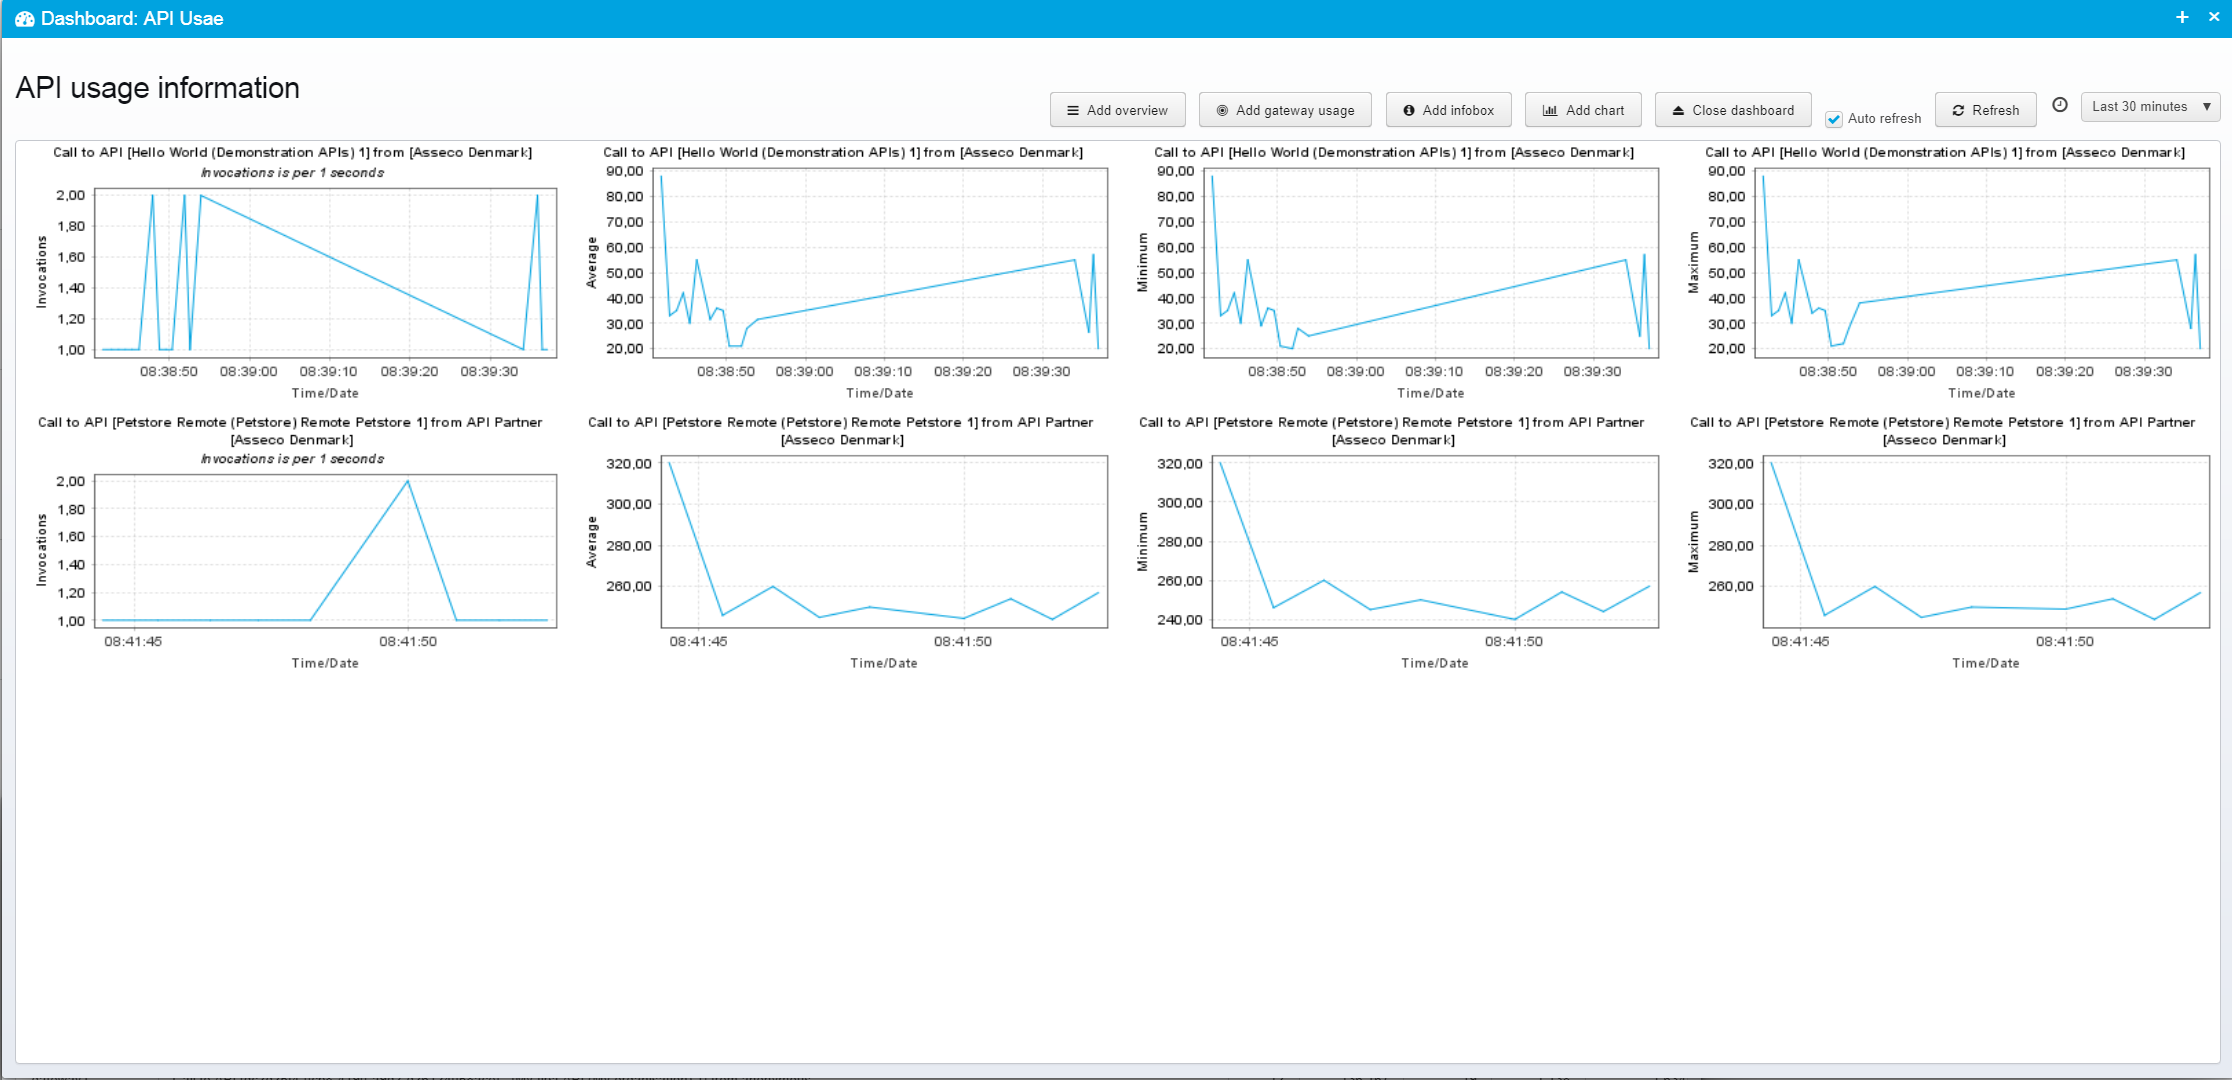
When the gateway is set up to record API usage information in the statistics, you can create dashboards or PDF reports showing information about API Usage based upon the statistics.
Go to Statistics → History, and type in "Call to API" in the Function Filter, this will give you information similar to this:
From here, you can add graphs to a dashboard.
See Dashboards for more information.
Accessing Elasticsearch data in PDF Reports
Like viewing API Usage data in Elasticsearch, you can also get the same information in PDF reports - see Creating PDF Reports for details.
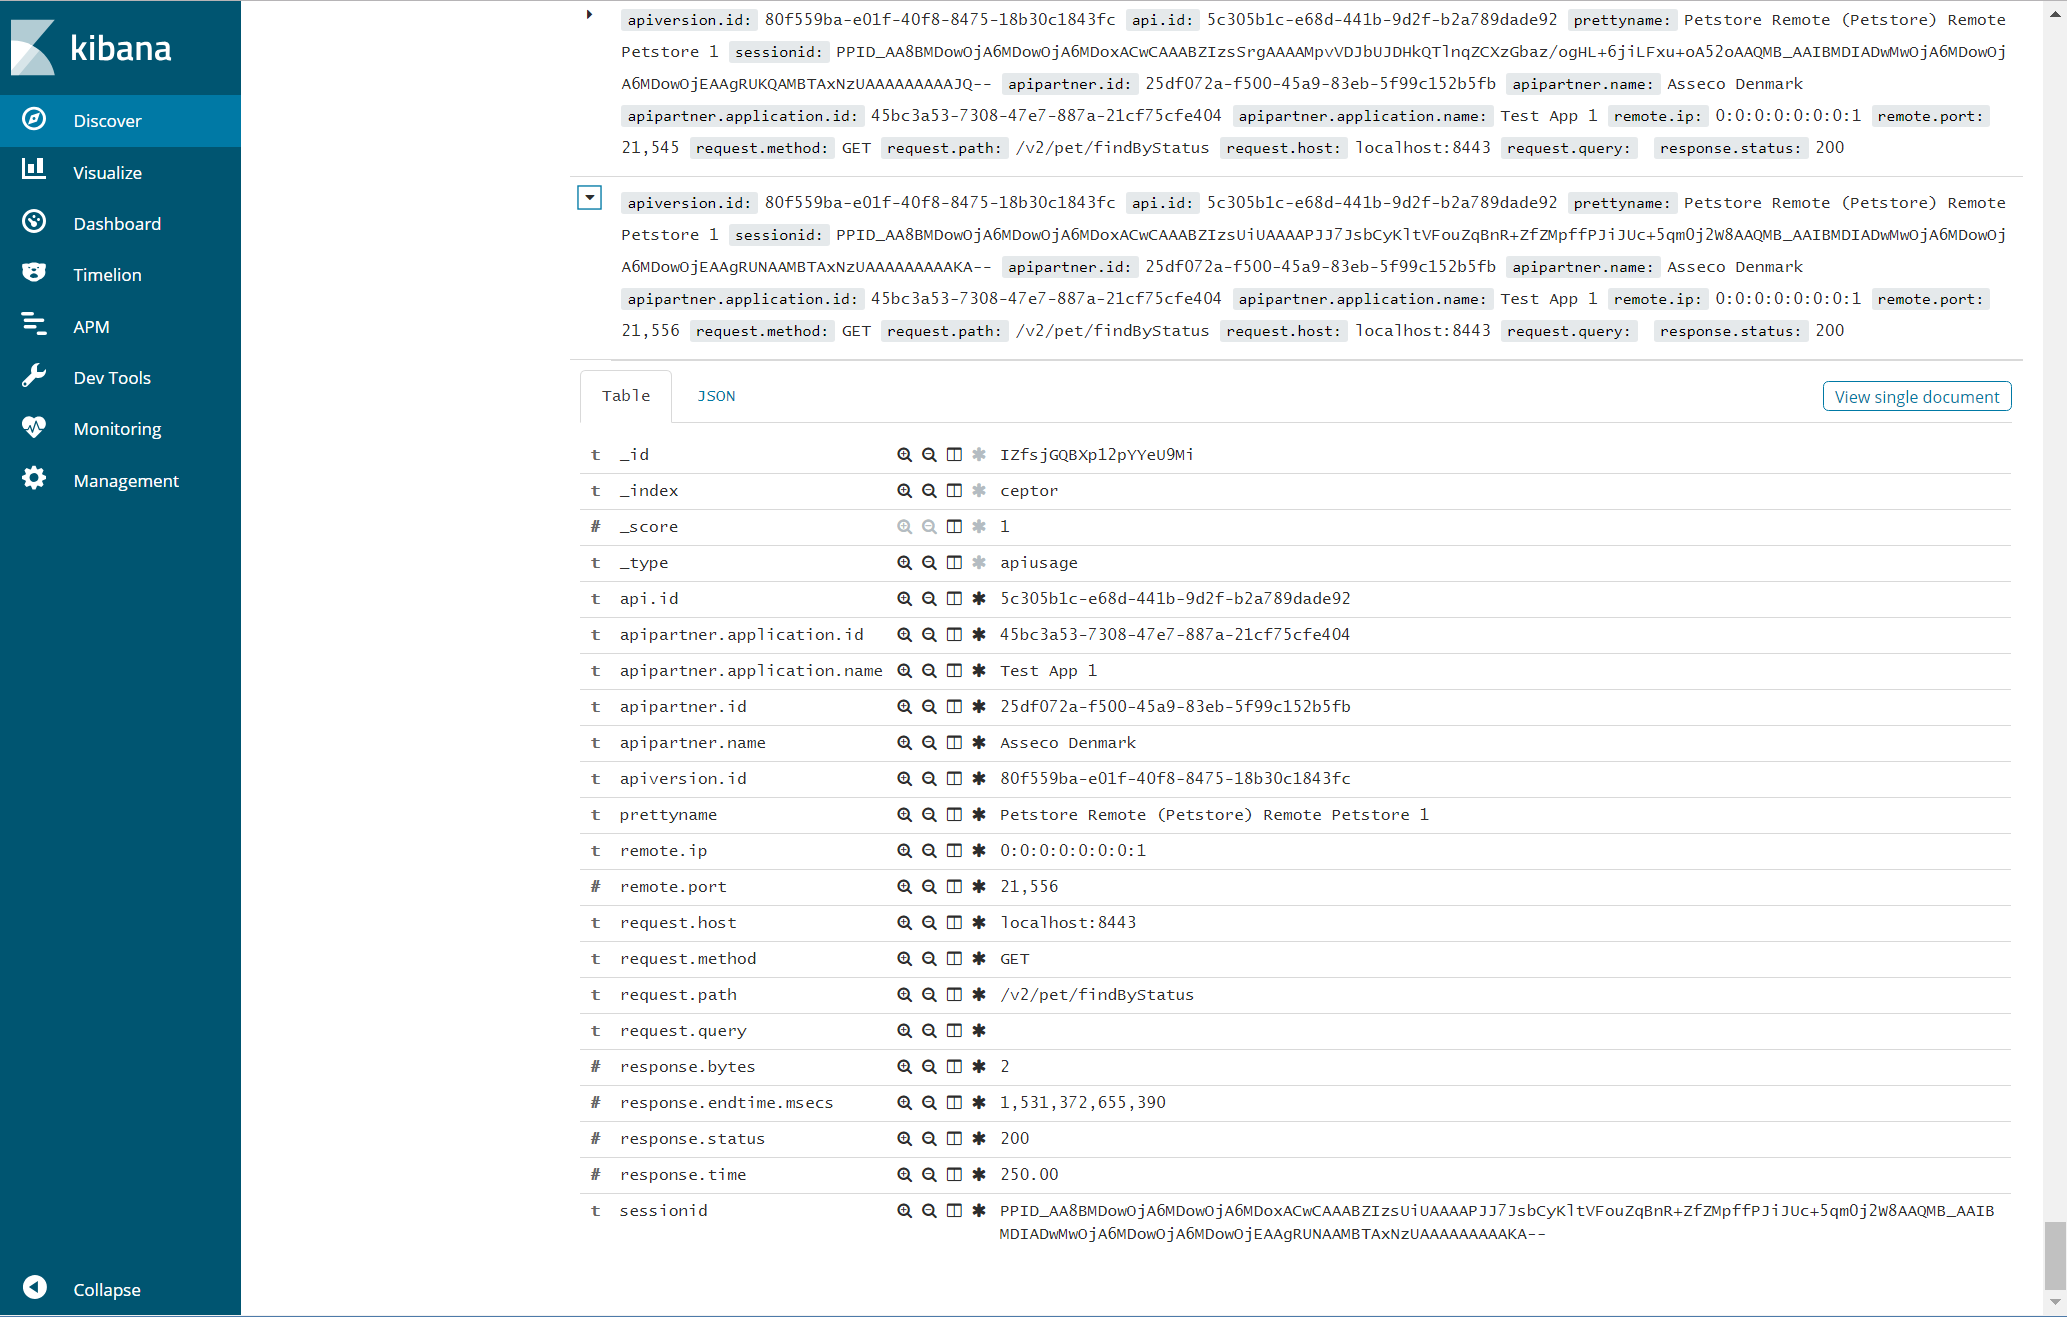
Viewing API Usage / Analytics in Kibana
Go to Kibana at http://localhost:5601/app/kibana (replace hostname with the one matching your installation)
Click discover to view the stored events, it will look similar to this:
You can view a getting started guide for Kibana and access the full documentation here: https://www.elastic.co/guide/en/kibana/current/getting-started.html
By default, the API Usage plugins provided with Ceptor are able to record information in this format:
{
	"apiversion.id": "a34a268f-34b1-465c-9327-262c2c69c4d3",
	"api.id": "3fe3ac57-c2da-4ce2-a2bc-25202f62c88b",
	"prettyname": "Hello World (Demonstration APIs) 1",
	"sessionid": "CEPID_AA8BMDowOjA6MDowOjA6MDoxACwCAAABZgeZf-AAAAANS03BgL8QbYIh6e-qCwKtlM9CTkIWwb1OoiDBzYW04fEAAQMB~AAIBMDIADwMwOjA6MDowOjA6MDowOjEAAgSQPQAMBTdGODAAAAAAAAABhQ",
	"apipartner.id": "25df072a-f500-45a9-83eb-5f99c152b5fb",
	"apipartner.name": "Ceptor ApS",
	"apipartner.application.id": "45bc3a53-7308-47e7-887a-21cf75cfe404",
	"apipartner.application.name": "Test App 1",
	"remote.ip": "0:0:0:0:0:0:0:1",
	"remote.port": 36925,
	"request.method": "GET",
	"request.path": "/hello/v1/hello",
	"request.host": "localhost:8443",
	// For requests with a body, request.body or request.body.base64 is available depending on payload being textual or binary
	"request.query": "",
	"request.headers": {
		"accept": "application/json",
		"accept-language": "da-DK,da;q=0.9,en-US;q=0.8,en;q=0.7",
		"accept-encoding": "gzip, deflate, br",
		"origin": "https://localhost:4243",
		"user-agent": "Mozilla/5.0 (Windows NT 6.3; Win64; x64) AppleWebKit/537.36 (KHTML, like Gecko) Chrome/69.0.3497.92 Safari/537.36",
		"connection": "keep-alive",
		"authorization": "Basic dGVzdDpzZWNyZXQ=",
		"referer": "https://localhost:4243/",
		"host": "localhost:8443"
	},
	"response.status": 200,
	"response.bytes": 37,
	"response.time": 52,
	"response.endtime.msecs": 1537725792274,
	"response.headers": {
		"access-control-allow-headers": "origin, accept, content-type, authorization, content-length, ceptor-apikey",
		"x-xss-protection": "1; mode=block",
		"date": "Sun, 23 Sep 2018 18:03:12 GMT",
		"connection": "keep-alive",
		"x-ratelimit-Remaining": "2",
		"strict-transport-security": "max-age=31536000; includeSubDomains",
		"x-ratelimit-limit": "5",
		"access-control-allow-methods": "GET, POST, PUT, PATCH, DELETE, HEAD, OPTIONS, TRACE",
		"x-ratelimit-reset": "1537725840",
		"x-frame-options": "sameorigin",
		"via": "1.1 gateway1 (Ceptor/6.0.3)",
		"access-control-allow-origin": "https://localhost:4243",
		"x-content-type-options": "nosniff",
		"content-type": "application/json",
		"content-length": "37",
		"x-ratelimit-timeunit": "minute",
		"access-control-max-age": "120"
	},
	"response.body": "{\"text\":\"How nice of you to call me\"}"
	// For binary responses, response.body.base64 is available instead
}
Related content
© Ceptor ApS. All Rights Reserved.
