Gateway Tracing
- Kim Rasmussen
- Patrick Ahmed (Unlicensed)
- Kim Rasmussen (Unlicensed)
From the Server Status page in the Ceptor Console, you can setup tracing for the gateway.
Tracing as a very useful tool for diagnosing problems where something unexpected happens - both if you need information on what your application does for a specific user, or if you need to diagnose issues with the configuration - such as which locations are hit and which are not, which conditions are triggered, output from scripts etc.
Click on "Gateway Tracer" to get to this screen:
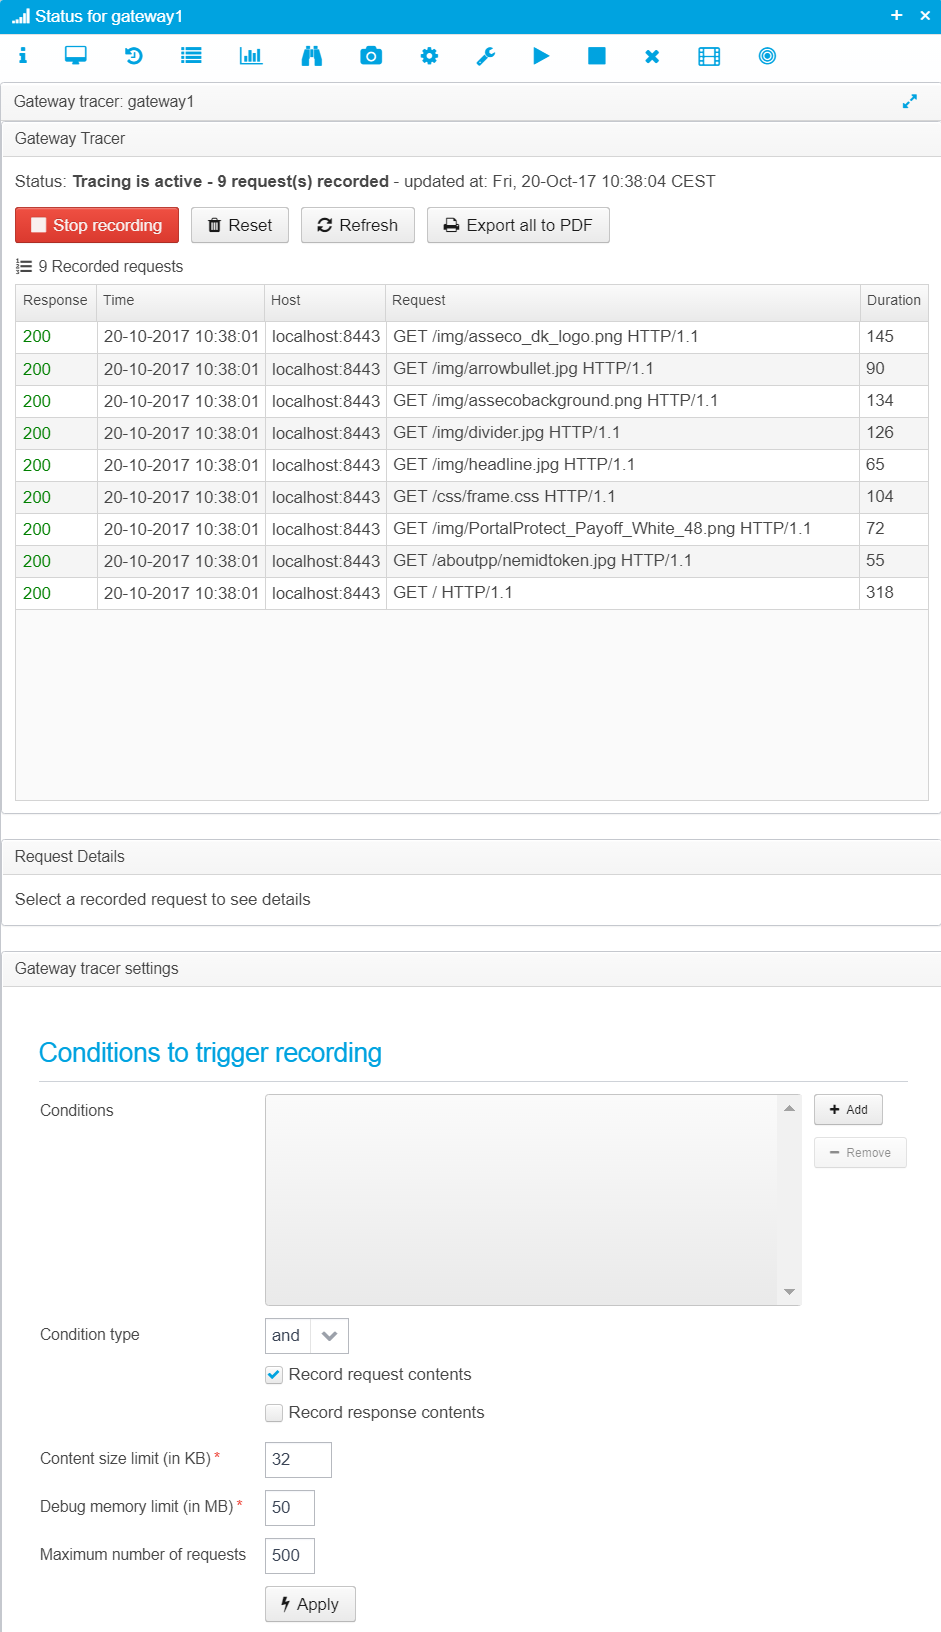
Here, you can setup conditions for tracing, start and stop it, and decide if you want to record request or response contents too.
You also need to specify memory limits to ensure that tracing does not fill up available memory.
By default, all requests will be traced (up to the maximum number of requests, which default to 100), and neither request nor response content will be saved - only headers.
But, unless your system is almost idle, you want to set some conditions on which requests you see in the trace - you can use the same set of conditions as you can configure for a location - see Config - Locations for details and explanations. Using these conditions, you can limit tracing to specific requests or users.
Remember to click "Apply" after you have changed conditions or limits.
Click "Start Recording" to start recording trace, and click "Refresh" to update the view and see any recorded requests.
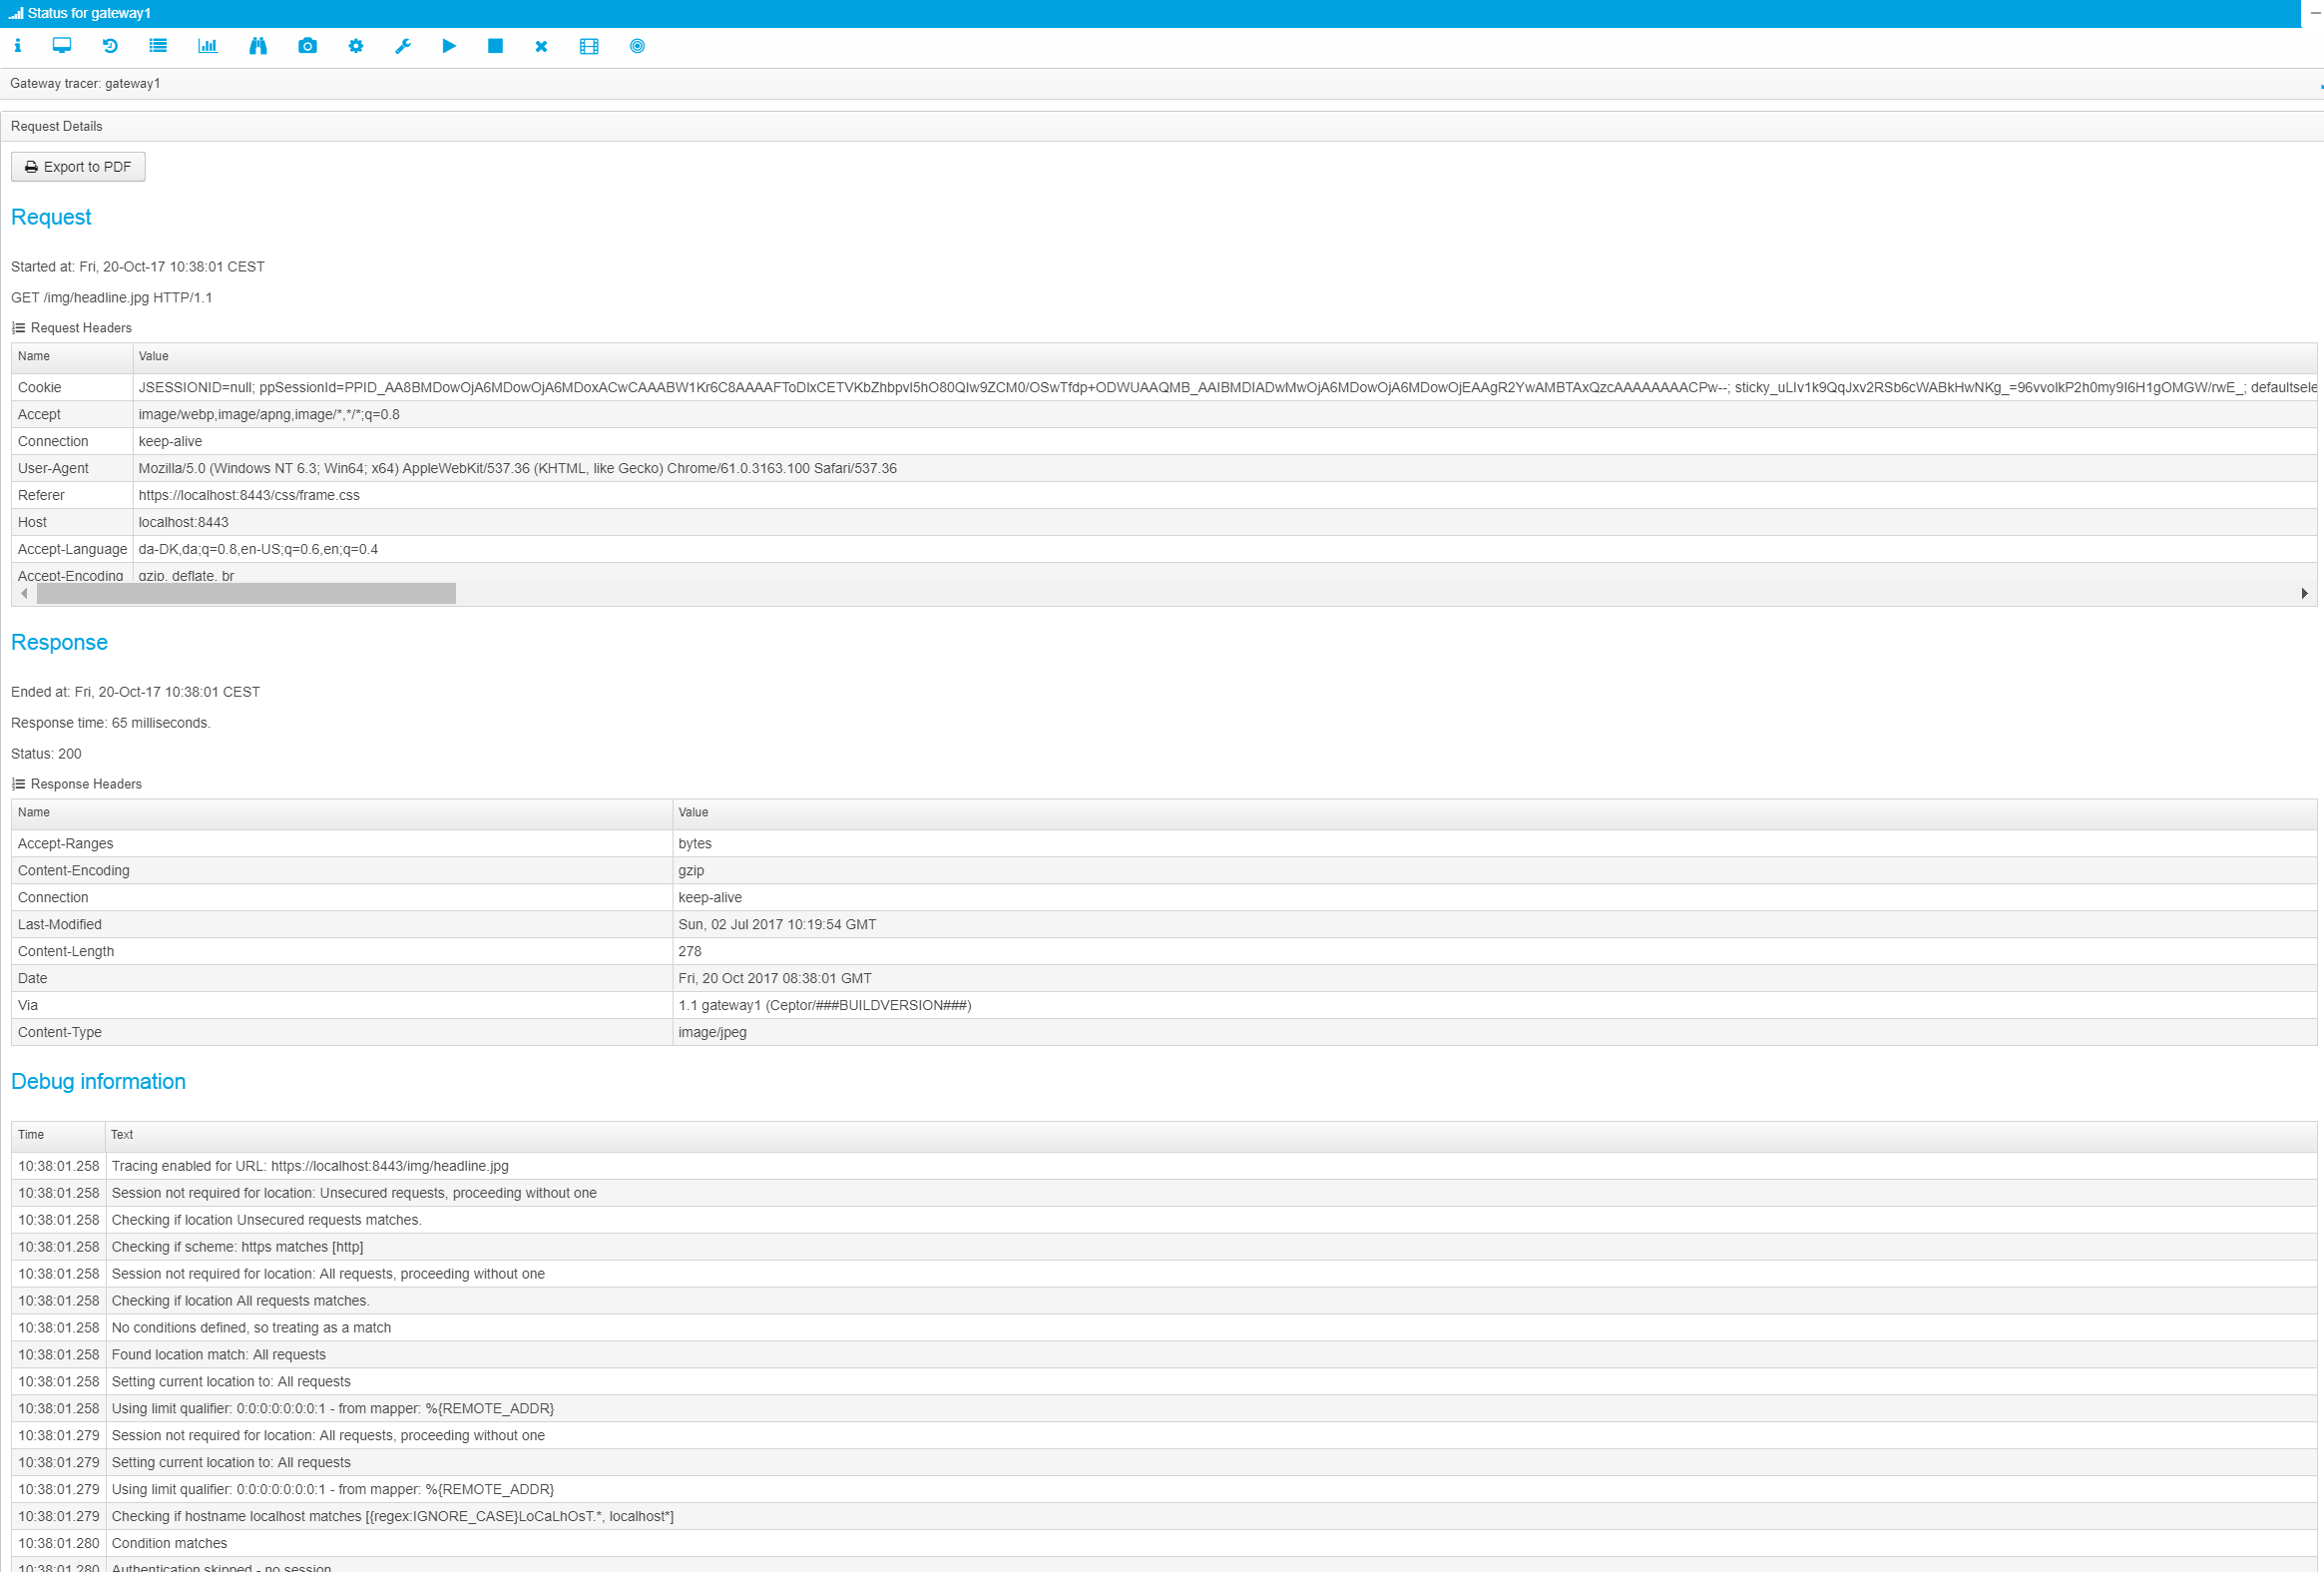
Click the request you wish to view more information about, and you can see its input and output, along with detailed trace explaining what the gateway did during processing of the request.
Below is an example with the browser zoomed out to display as much information as possible:
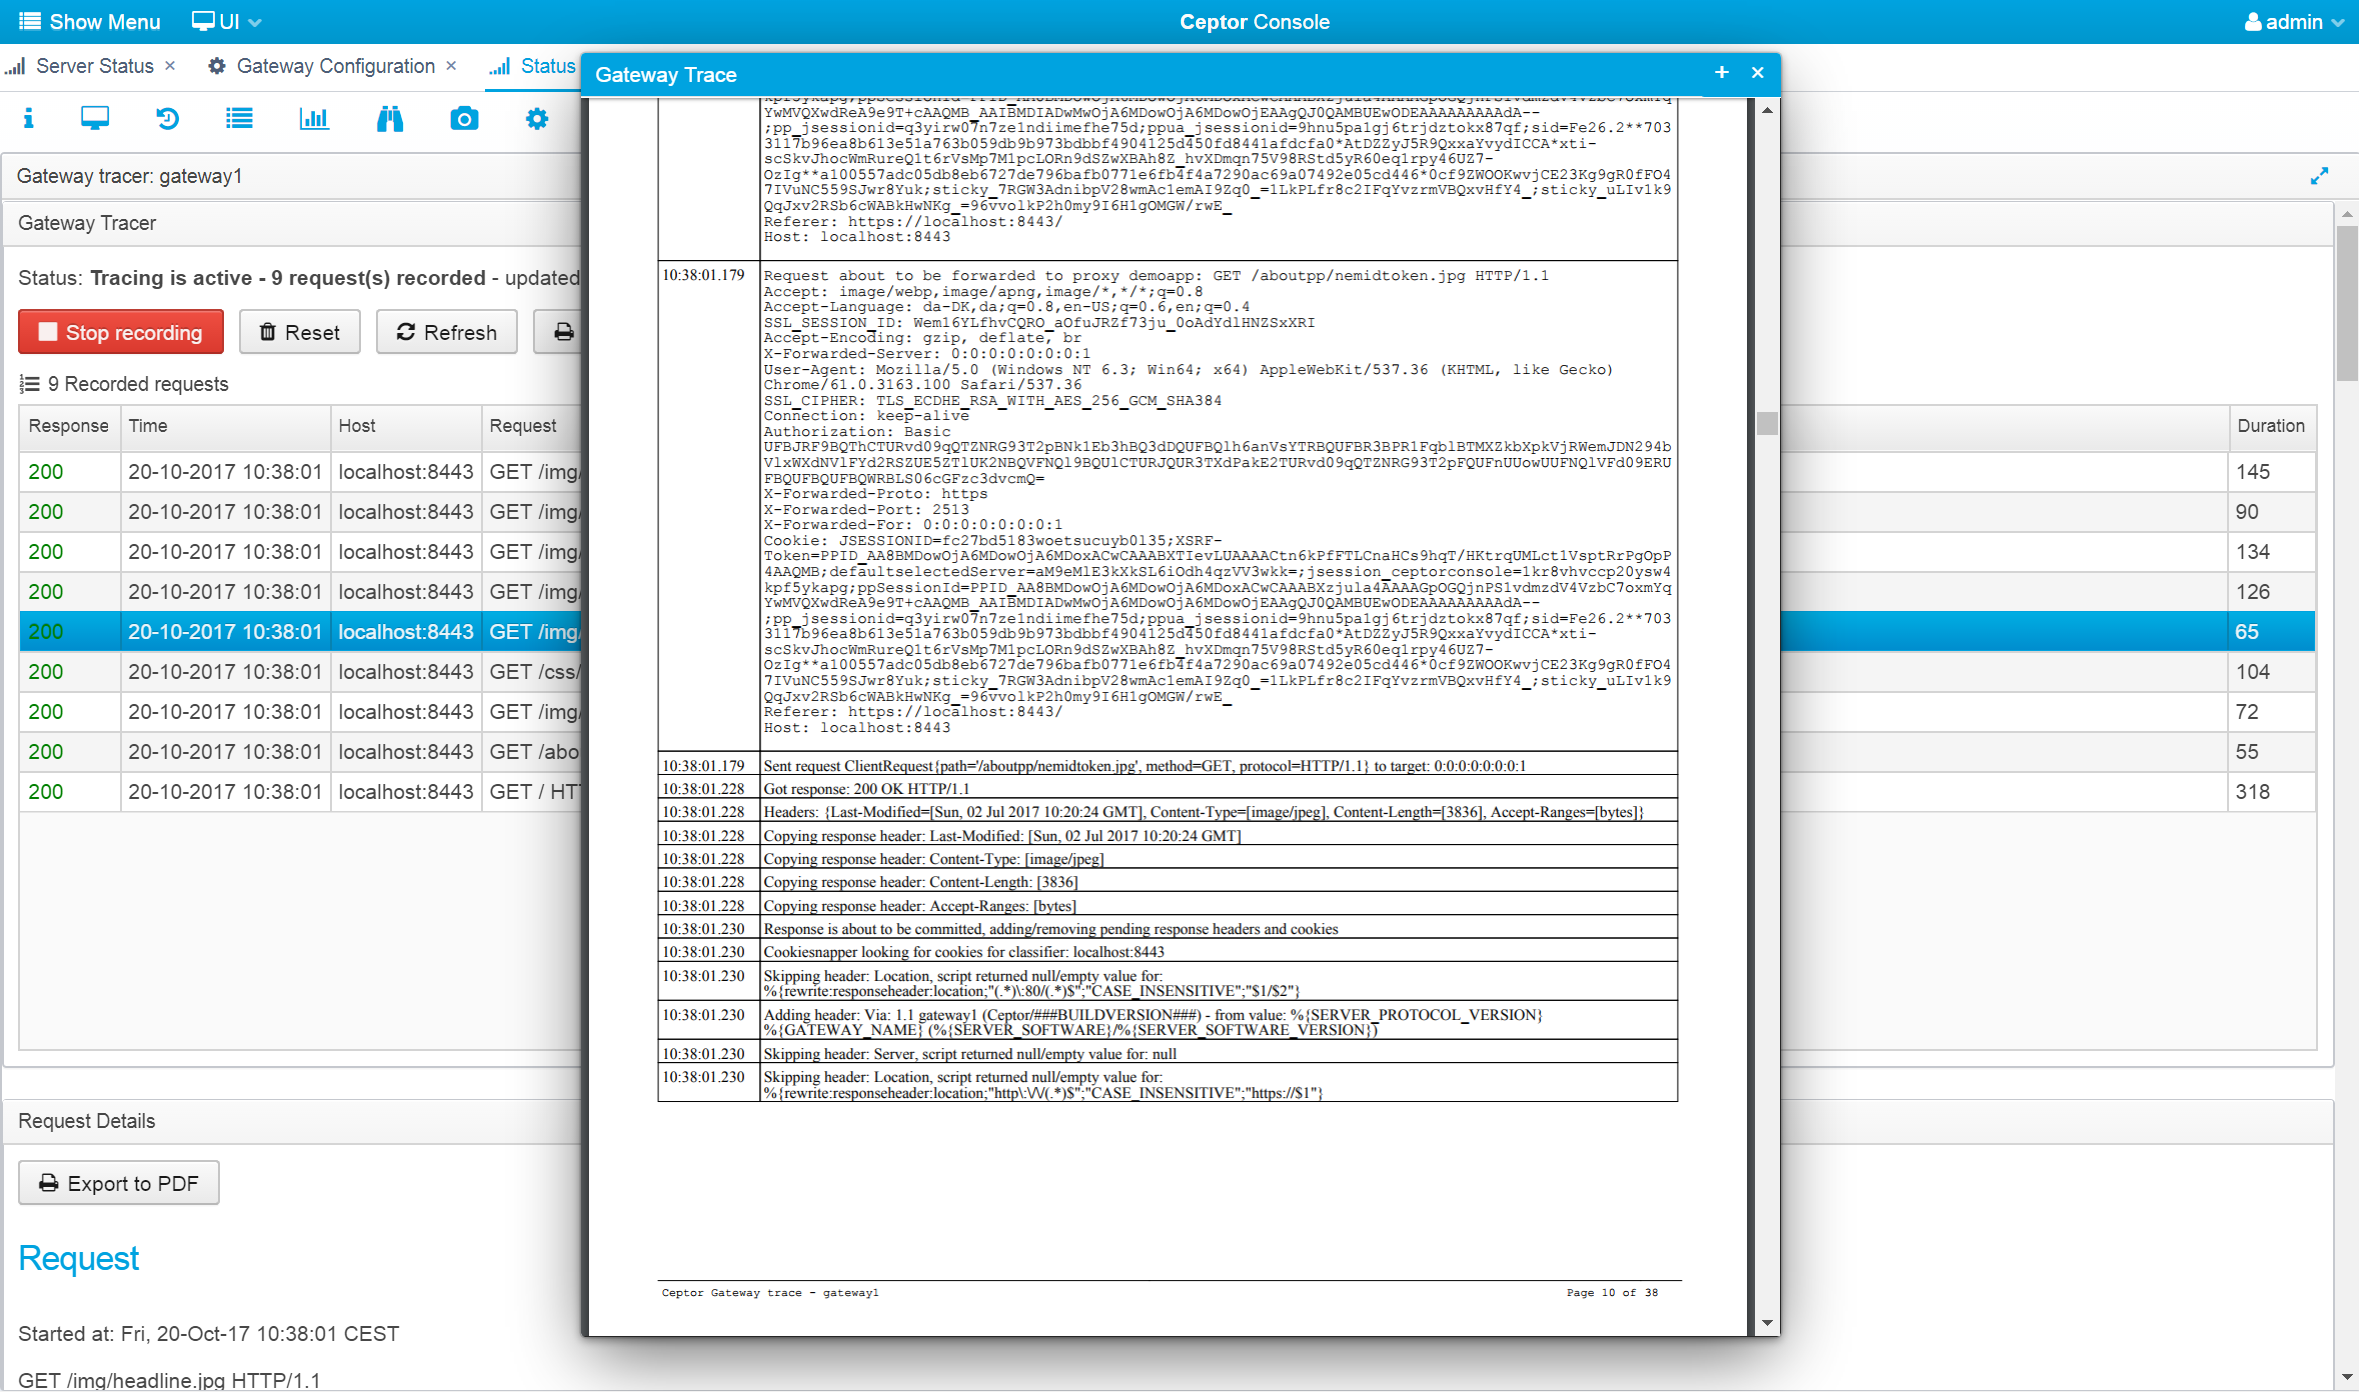
Exporting a Trace to PDF
To further help diagnosing any issues, you can export all the captured traces to PDF, or you can select an individual request and just export that to PDF.
This will generate a PDF file and open that in a viewer - here, you can download it.
© Ceptor ApS. All Rights Reserved.