Creating PDF Reports
- Kim Rasmussen
- Patrick Ahmed (Unlicensed)
- Kim Rasmussen (Unlicensed)
You can create customized PDF reports based on the measured statistics from the statistics server. The reports contain selected information taken from the statistics for a given time period.
Below is shown a couple of pages from such a report.
Generating a PDF Report
The report is created either by the command-line administration client (see the section about the Administration API on page ) or by doing so from the PortalProtect Administration web interface.
When using the web interface, view the statusdetails for the statistics server, in there you will see a list of different reports available. The list of possible reports can be customized by changing the configuration property pdf.reports – refer to the configuration reference later in this document for more information about how to customize this.
Report Definition
The report is based on an XML file which specifies the contents of the report – many things can be tailored in this report, from the title to descriptive text on each page along with various charts showing specific parts of the statistics.
The XML report definition file is composed of a number of elements, the most important ones listed here:
- welcome-page Welcome page, the first page of the report
- title Report title
- logo Logo image
- cover Cover page - can be specified instead of a logo to include a pdf as a cover page
- page Define one page in the report
- title Page title
- text Descriptive text
- markdown HTML markdown syntax
- chart Create and show a chart on the page
- title Char title
- type piechart or line chart
- show-axis One or more of: count, average, minimum, maximum
- server Adds one or more item to the chart
- name Name of the server
- function Function, measuring point name
- legend Legend to put on graph
- summarize Summarize entries
- elasticsearch Input to elasticsearch query
This is the overview of the elements available.
The chart is very powerful, and can summarize and display many different measurements in one graph.
As an example, the following chart definition produces the chart below:
<chart>
  <title>Minimum Memory usage</title>
  <type>linechart</type>
  <size>510,300</size>
  <position>40,400</position>
  <show-axis>minimum</show-axis>
  <server>
    <name>*</name>
    <function>used memory (kb)</function>
    <legend>${server}</legend>
  </server>
</chart>
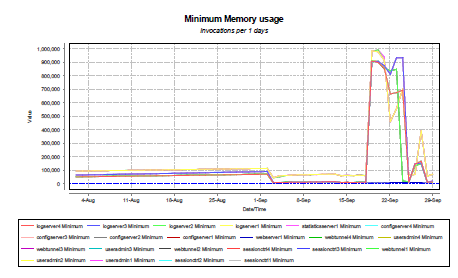
Digging a little deeper into the definition, we can see that the function is set to "used memory (kb)" which is the number of kilobytes allocated memory. The name is *, matching all servers visible to PortalProtect, and the legend is ${server} telling the chart component that the name of each server matching the entry should be put in the graph.
Summarize is not used in this example, so there will be one line per matching entry on the graph.
Pattern matching (* and ?) can be used for both the server name and function name to select multiple entries, and | can be used to match multiple values, e.g. "sessionctrl1|sessionctrl2".
If we look at another example:
<chart>
  <title>Database maximum response time</title>
  <type>linechart</type>
  <size>510,300</size>
  <position>40,400</position>
  <show-axis>count</show-axis>
  <show-axis>maximum</show-axis>
  <server>
    <name>*</name>
    <function>JDBC Statement.execute*</function>
    <summarize>server</summarize>
  </server>
</chart>
Then this chart will display the maximum response time of the database. The function is set to "JDBC Statement.execute*" so it will match both the "JDBC Statement.executeQuery" and "JDBC Statement.executeUpdate" functions, but it will summarize those values per server, so one line is created on the chart for each server with the combined values for both executeQuery and executeUpdate.
A more complicated example:
<chart>
  <title>Application Server Response Time</title>
  <type>linechart</type>
  <show-axis>count</show-axis>
  <show-axis>average</show-axis>
  <server>
    <name>*</name>
    <function>WebServer response time</function>
    <legend>Total</legend>
    <summarize>all</summarize>
  </server>
  <server>
    <name>*</name>
    <function>WebServer response time</function>
    <legend>${server}</legend>
  </server>
</chart>
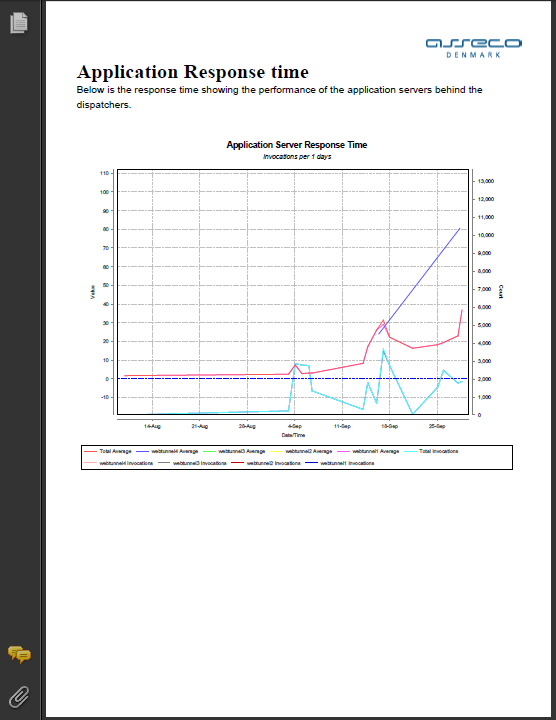
Here, there are two server definitions, one that summarizes on the total, creating a line in the chart with the legend "Total" showing the total HTTP response time from the application servers, seen from the dispatcher, and another number of lines (one for each dispatcher) with the response time seen from that particular dispatcher.
Including API Usage Data in Reports
When using API Management, if you have configured Ceptor Gateway to store API Usage data within Elasticsearch (see API Usage / Analytics for more info) then you can also include data from Elasticsearch in your reports.
Instead of specifying a <server> tag in your chart, you can add <elasticsearc> and provide the input to an Elasticsearch query there. If you need help constructing the input, you can do this in Ceptor Console (see Dashboards) where you can copy the Elasticsearch data from a dashboard.
<chart>
	<!-- Chart title -->
	<title>API Invocations</title>
	<!-- Chart type, can be either piechart or linechart -->
	<type>piechart</type>
	<!-- Size of the chart -->
	<size>510,270</size>
	<elasticsearch><![CDATA[{
  "query": {
    "bool": {
      "must": [
        {
          "match_all": {}
        }
      ],
      "filter": {
        "range": {
          "response.endtime.msecs": {
            "gte": 0,
            "lte": 999999999999999
          }
        }
      }
    }
  },
  "aggs": {
    "API": {
      "terms": {
        "field": "prettyname.keyword",
        "size": 10
      },
      "aggs": {
        "Calls": {
          "value_count": {
            "field": "response.status"
          }
        }
      }
    }
  }
}
]]>
	</elasticsearch>
</chart>
XML Sample Report Definition
Below is a complete example of a report definition xml file.
<?xml version="1.0" encoding="utf-8"?>
<!-- This is the default report template. Note that all images referred to
in this xml document are loaded either from a file, or from the classpath
in case the referenced file does ont exist. -->
<statreport xmlns:xsi="http://www.w3.org/2001/XMLSchema-instance" xsi:noNamespaceSchemaLocation="statreport.xsd">
<!-- The <toprightlogo> image is shown at the top right corner of every
page. -->
<toprightlogo>asseco_denmark_doc.png</toprightlogo>
<topleftlogo>ceptor_doc.png</topleftlogo>
<content>
<!-- A welcome-page should contain the title of this report, and a logo
image. Information about the time period within the report will be added
automatically -->
<welcome-page>
<!-- Title on front page, and title of document -->
<title>Ceptor</title>
<!-- Subtitle will appear in white below the title, is only shown if cover page is set, not if logo is set instead of cover -->
<subtitle>Statistics</subtitle>
<!-- Use either logo or cover here -->
<!-- <logo>asseco_building.jpg</logo> -->
<cover>CeptorCover.pdf</cover>
</welcome-page>
<!-- Here, you can add any number of pages to the report -->
<page>
<!-- Page title -->
<title>Overview</title>
<!-- Within each page, you can add any number of <text> and <chart> elements -->
<!-- A text element is simply a block of text which will be displayed
on the PDF page -->
<text>Below is an overview of the general load on the system, the number of logins performed, HTTP requests processed etc.</text>
<!-- A chart added to the page -->
<chart>
<!-- Chart title -->
<title>Logins</title>
<!-- Chart type, can be either piechart or linechart -->
<type>piechart</type>
<!-- Size of the chart -->
<size>510,270</size>
<!-- Which axis to show, can average, minimum, maximum or count, note that multiple <show-axis> elements can be added to the same chart -->
<show-axis>count</show-axis>
<!-- Specify which measured server/function to add to the chart, note that multiple <server> elements can be added to the same chart -->
<server>
<!-- Match any server starting with the name "session", ? and * wildcards can be used to match names -->
<name>session*</name>
<!-- Functions (measurement points) to select from -->
<function>Login using plugin: [*]</function>
<!--
How should plots be summarized ? can be none, all, server or function
This determines how many plots on the chart will be made depending on which patters the <name> and <function> tag matches.
-->
<summarize>function</summarize>
</server>
</chart>
<chart>
<title>Database</title>
<type>linechart</type>
<size>510,380</size>
<position>40,20</position>
<show-axis>count</show-axis>
<show-axis>average</show-axis>
<show-axis>maximum</show-axis>
<server>
<name>useradmin*</name>
<function>JDBC Statement.execute</function>
<legend>execute</legend>
<summarize>function</summarize>
</server>
<server>
<name>useradmin*</name>
<function>JDBC Statement.executeQuery</function>
<legend>executeQuery</legend>
<summarize>function</summarize>
</server>
<server>
<name>useradmin*</name>
<function>JDBC Statement.executeUpdate</function>
<legend>executeUpdate</legend>
<summarize>function</summarize>
</server>
</chart>
</page>
<page>
<!-- Page title -->
<title>API Usage</title>
<!-- Within each page, you can add any number of <text> and <chart> elements -->
<!-- A text element is simply a block of text which will be displayed
on the PDF page -->
<text>Here, we have some API usage information showing calls to some of the APIs.</text>
<!-- A chart added to the page -->
<chart>
<!-- Chart title -->
<title>API Invocations</title>
<!-- Chart type, can be either piechart or linechart -->
<type>piechart</type>
<!-- Size of the chart -->
<size>510,270</size>
<elasticsearch><![CDATA[{
"query": {
"bool": {
"must": [
{
"match_all": {}
}
],
"filter": {
"range": {
"response.endtime.msecs": {
"gte": 0,
"lte": 999999999999999
}
}
}
}
},
"aggs": {
"API": {
"terms": {
"field": "prettyname.keyword",
"size": 10
},
"aggs": {
"Calls": {
"value_count": {
"field": "response.status"
}
}
}
}
}
}
]]>
</elasticsearch>
</chart>
<chart>
<title>APIs and HTTP Status codes</title>
<type>linechart</type>
<size>510,380</size>
<position>40,20</position>
<elasticsearch><![CDATA[{
"query": {
"bool": {
"must": [
{
"match_all": {}
}
],
"filter": {
"range": {
"response.endtime.msecs": {
"gte": 0,
"lte": 999999999999999
}
}
}
}
},
"aggs": {
"API": {
"histogram": {
"field": "response.endtime.msecs",
"interval": 60000,
"min_doc_count": 1
},
"aggs": {
"Calls": {
"terms": {
"field": "prettyname.keyword",
"size": 10
},
"aggs": {
"HTTP Status": {
"terms": {
"field": "response.status",
"size": 100
}
}
}
}
}
}
}
}]]>
</elasticsearch>
</chart>
</page>
<page>
<title>Database</title>
<text>Here, information about the usage and performance of the database is shown.</text>
<chart>
<title>Database average response time</title>
<type>linechart</type>
<size>510,300</size>
<position>40,50</position>
<show-axis>count</show-axis>
<show-axis>average</show-axis>
<server>
<name>*</name>
<function>JDBC Statement.execute</function>
<!-- Specify the legend, ${server} is replaced with the matching server
name -->
<legend>${server} execute</legend>
<summarize>server</summarize>
</server>
<server>
<name>*</name>
<function>JDBC Statement.executeQuery</function>
<legend>${server} executeQuery</legend>
</server>
<server>
<name>*</name>
<function>JDBC Statement.executeUpdate</function>
<legend>${server} executeUpdate</legend>
</server>
</chart>
<chart>
<title>Database maximum response time</title>
<type>linechart</type>
<size>510,300</size>
<position>40,400</position>
<show-axis>count</show-axis>
<show-axis>maximum</show-axis>
<server>
<name>*</name>
<function>JDBC Statement.execute*</function>
<summarize>server</summarize>
</server>
</chart>
</page>
<page>
<title>Destination server Performance Summary</title>
<!--
Markdown syntax - see http://daringfireball.net/projects/markdown/syntax/
In here, you can add simple formatting.
Variables:
Notice the ${stat:count:"*":"WebServer response time"} variable - this allows you to extract
numbers from the statistics, in this case the number of calls to "WebServer response Time" for all servers.
This special variable can be used both within <text> and <markdown> tags. Its contents is replaced
with the appropriate value.
The syntax is:
${stat:<type>:"<servers>":"<functions>"}
where <type> is one of count, average, minimum, maximum or total.
and <servers> and <functions> can contain wildcards and are used to match relevant servers and
functions to provide data for.
You can also use the variable ${currenttimestamp} which is replaced with the current time and date
in the generated PDF report.
-->
<markdown>
<![CDATA[
Below is a quick summary of the average performance of applications/services
Data is from ${currenttimestamp}
<p/>
<p/>
<table border="1">
<tr>
<td>Number of calls</td>
<td>${stat:count:"*":"WebServer response time"}</td>
</tr>
<tr>
<td>Minimum response time</td>
<td>${stat:minimum:"*":"WebServer response time"}</td>
</tr>
<tr>
<td>Maximum response time</td>
<td>${stat:maximum:"*":"WebServer response time"}</td>
</tr>
<tr>
<td>Average response time</td>
<td>${stat:average:"*":"WebServer response time"}</td>
</tr>
</table>
Please note that these data are aggregated for all transactions, no matter which type
]]>
</markdown>
</page>
<page>
<title>Application Response time</title>
<text>Below is the response time showing the performance of the application servers behind the gateways.</text>
<text></text>
<chart>
<title>Application Server Response Time</title>
<type>linechart</type>
<show-axis>count</show-axis>
<show-axis>average</show-axis>
<server>
<name>*</name>
<function>WebServer response time</function>
<legend>Total</legend>
<summarize>all</summarize>
</server>
<server>
<name>*</name>
<function>WebServer response time</function>
<legend>${server}</legend>
</server>
</chart>
</page>
<page>
<title>Logins</title>
<text>Shows the performance of each type of login, both the average and the maximum time taken is shown. Note that the time often corresponds with backend systems such as the database.</text>
<text></text>
<chart>
<title>Logins</title>
<type>linechart</type>
<show-axis>count</show-axis>
<show-axis>average</show-axis>
<show-axis>maximum</show-axis>
<server>
<name>session*</name>
<function>Login using plugin: [*]</function>
<summarize>function</summarize>
</server>
</chart>
</page>
<page>
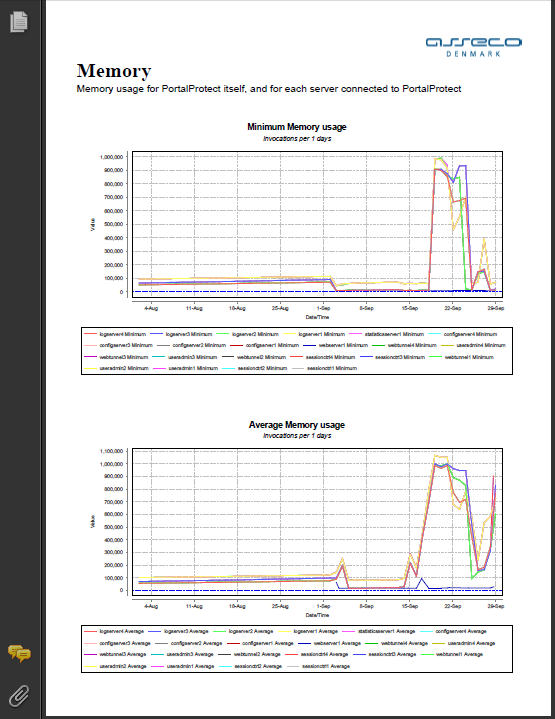
<title>Memory</title>
<text>Memory usage for Ceptor servers</text>
<chart>
<title>Average Memory usage</title>
<type>linechart</type>
<size>510,300</size>
<position>40,50</position>
<show-axis>average</show-axis>
<server>
<name>config*</name>
<function>used memory (kb)</function>
<legend>${server}</legend>
</server>
</chart>
<chart>
<title>Minimum Memory usage</title>
<type>linechart</type>
<size>510,300</size>
<position>40,400</position>
<show-axis>minimum</show-axis>
<server>
<name>config*</name>
<function>used memory (kb)</function>
<legend>${server}</legend>
</server>
</chart>
</page>
</content>
</statreport>
XML Schema
This is the schema the XML reports files need to adhere to:
<?xml version="1.0" encoding="utf-8"?>
<xs:schema id="statreport" xmlns="" xmlns:xs="http://www.w3.org/2001/XMLSchema">
  <xs:element name="statreport">
    <xs:complexType>
      <xs:sequence>
        <xs:element name="toprightlogo" type="xs:string" minOccurs="0" />
        <xs:element name="topleftlogo" type="xs:string" minOccurs="0" />
        <xs:element name="content" minOccurs="0" maxOccurs="unbounded">
          <xs:complexType>
            <xs:sequence>
              <xs:element name="welcome-page" minOccurs="0" maxOccurs="1">
                <xs:complexType>
                  <xs:sequence>
                    <xs:element name="title" type="xs:string" minOccurs="0" />
                    <xs:element name="subtitle" type="xs:string" minOccurs="0" />
                    <xs:choice minOccurs="0">
	                    <xs:element name="logo" type="xs:string" />
	                    <xs:element name="cover" type="xs:string" />
                    </xs:choice>
                  </xs:sequence>
                </xs:complexType>
              </xs:element>
              <xs:element name="page" minOccurs="0" maxOccurs="unbounded">
                <xs:complexType>
                  <xs:sequence>
                  	 <xs:choice maxOccurs="unbounded">
	                    <xs:element name="title" type="xs:string"/>
	                    <xs:element name="text" type="xs:string" />
	                    <xs:element name="markdown" type="xs:string"/>
	                    <xs:element name="chart" minOccurs="0">
	                      <xs:complexType>
	                        <xs:sequence>
	                          <xs:element name="title" type="xs:string" minOccurs="0" maxOccurs="1"/>
	                          <xs:element name="type" type="xs:string" minOccurs="1" maxOccurs="1"/>
	                          <xs:element name="size" type="xs:string" minOccurs="0" maxOccurs="1"/>
	                          <xs:element name="position" type="xs:string" minOccurs="0" maxOccurs="1"/>
	                          <xs:element name="show-axis" nillable="true" minOccurs="0" maxOccurs="unbounded">
	                            <xs:complexType>
	                              <xs:simpleContent>
	                                <xs:extension base="xs:string">
	                                </xs:extension>
	                              </xs:simpleContent>
	                            </xs:complexType>
	                          </xs:element>
	                          <xs:element name="server" minOccurs="0" maxOccurs="unbounded">
	                            <xs:complexType>
	                              <xs:sequence>
	                                <xs:element name="name" type="xs:string" minOccurs="1" maxOccurs="1"/>
	                                <xs:element name="function" type="xs:string" minOccurs="1" maxOccurs="1"/>
	                                <xs:element name="legend" type="xs:string" minOccurs="0" />
	                                <xs:element name="summarize" type="xs:string" minOccurs="0" />
	                              </xs:sequence>
	                            </xs:complexType>
	                          </xs:element>
	                          <xs:element name="elasticsearch" type="xs:string" minOccurs="0" maxOccurs="1"/>
	                        </xs:sequence>
	                      </xs:complexType>
	                    </xs:element>
	                 </xs:choice>
                  </xs:sequence>
                </xs:complexType>
              </xs:element>
            </xs:sequence>
          </xs:complexType>
        </xs:element>
      </xs:sequence>
    </xs:complexType>
  </xs:element>
</xs:schema>
© Ceptor ApS. All Rights Reserved.