You can create customized PDF reports based on the measured statistics from the statistics server. The reports contain selected information taken from the statistics for a given time period.
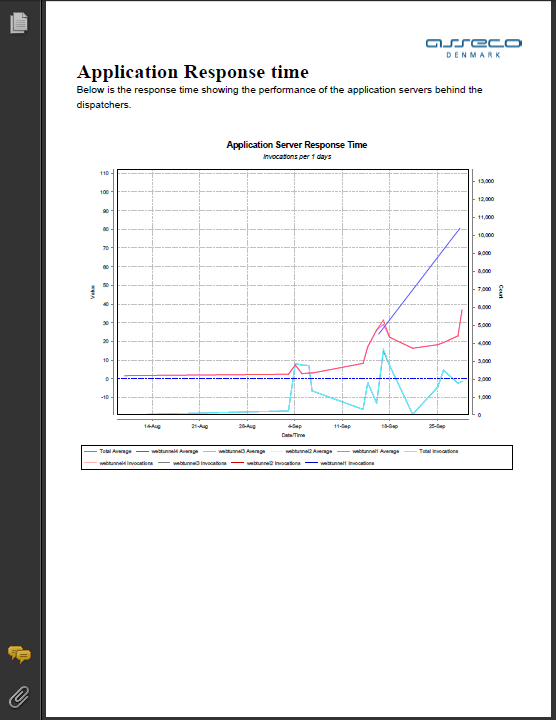
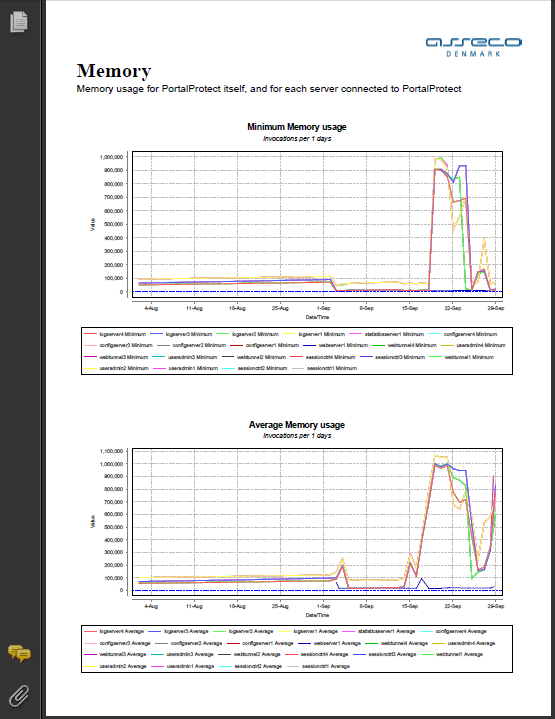
Below is shown a couple of pages from such a report.
Generating a PDF
...
Report
The report is created either by the command-line administration client (see the section about the Administration API on page ) or by doing so from the PortalProtect Administration web interface.
When using the web interface, view the statusdetails for the statistics server, in there you will see a list of different reports available. The list of possible reports can be customized by changing the configuration property pdf.reports – refer to the configuration reference later in this document for more information about how to customize this.
Report
...
Definition
The report is based on an XML file which specifies the contents of the report – many things can be tailored in this report, from the title to descriptive text on each page along with various charts showing specific parts of the statistics.
The XML report definition file is composed of a number of elements, the most important ones listed here:
...
Here, there are two server definitions, one that summarizes on the total, creating a line in the chart with the legend "Total" showing the total HTTP response time from the application servers, seen from the dispatcher, and another number of lines (one for each dispatcher) with the response time seen from that particular dispatcher.
Including API Usage
...
Data in
...
Reports
When using API Management, if you have configured Ceptor Gateway to store API Usage data within Elasticsearch (see API Usage / Analytics for more info) then you can also include data from Elasticsearch in your reports.
...