...
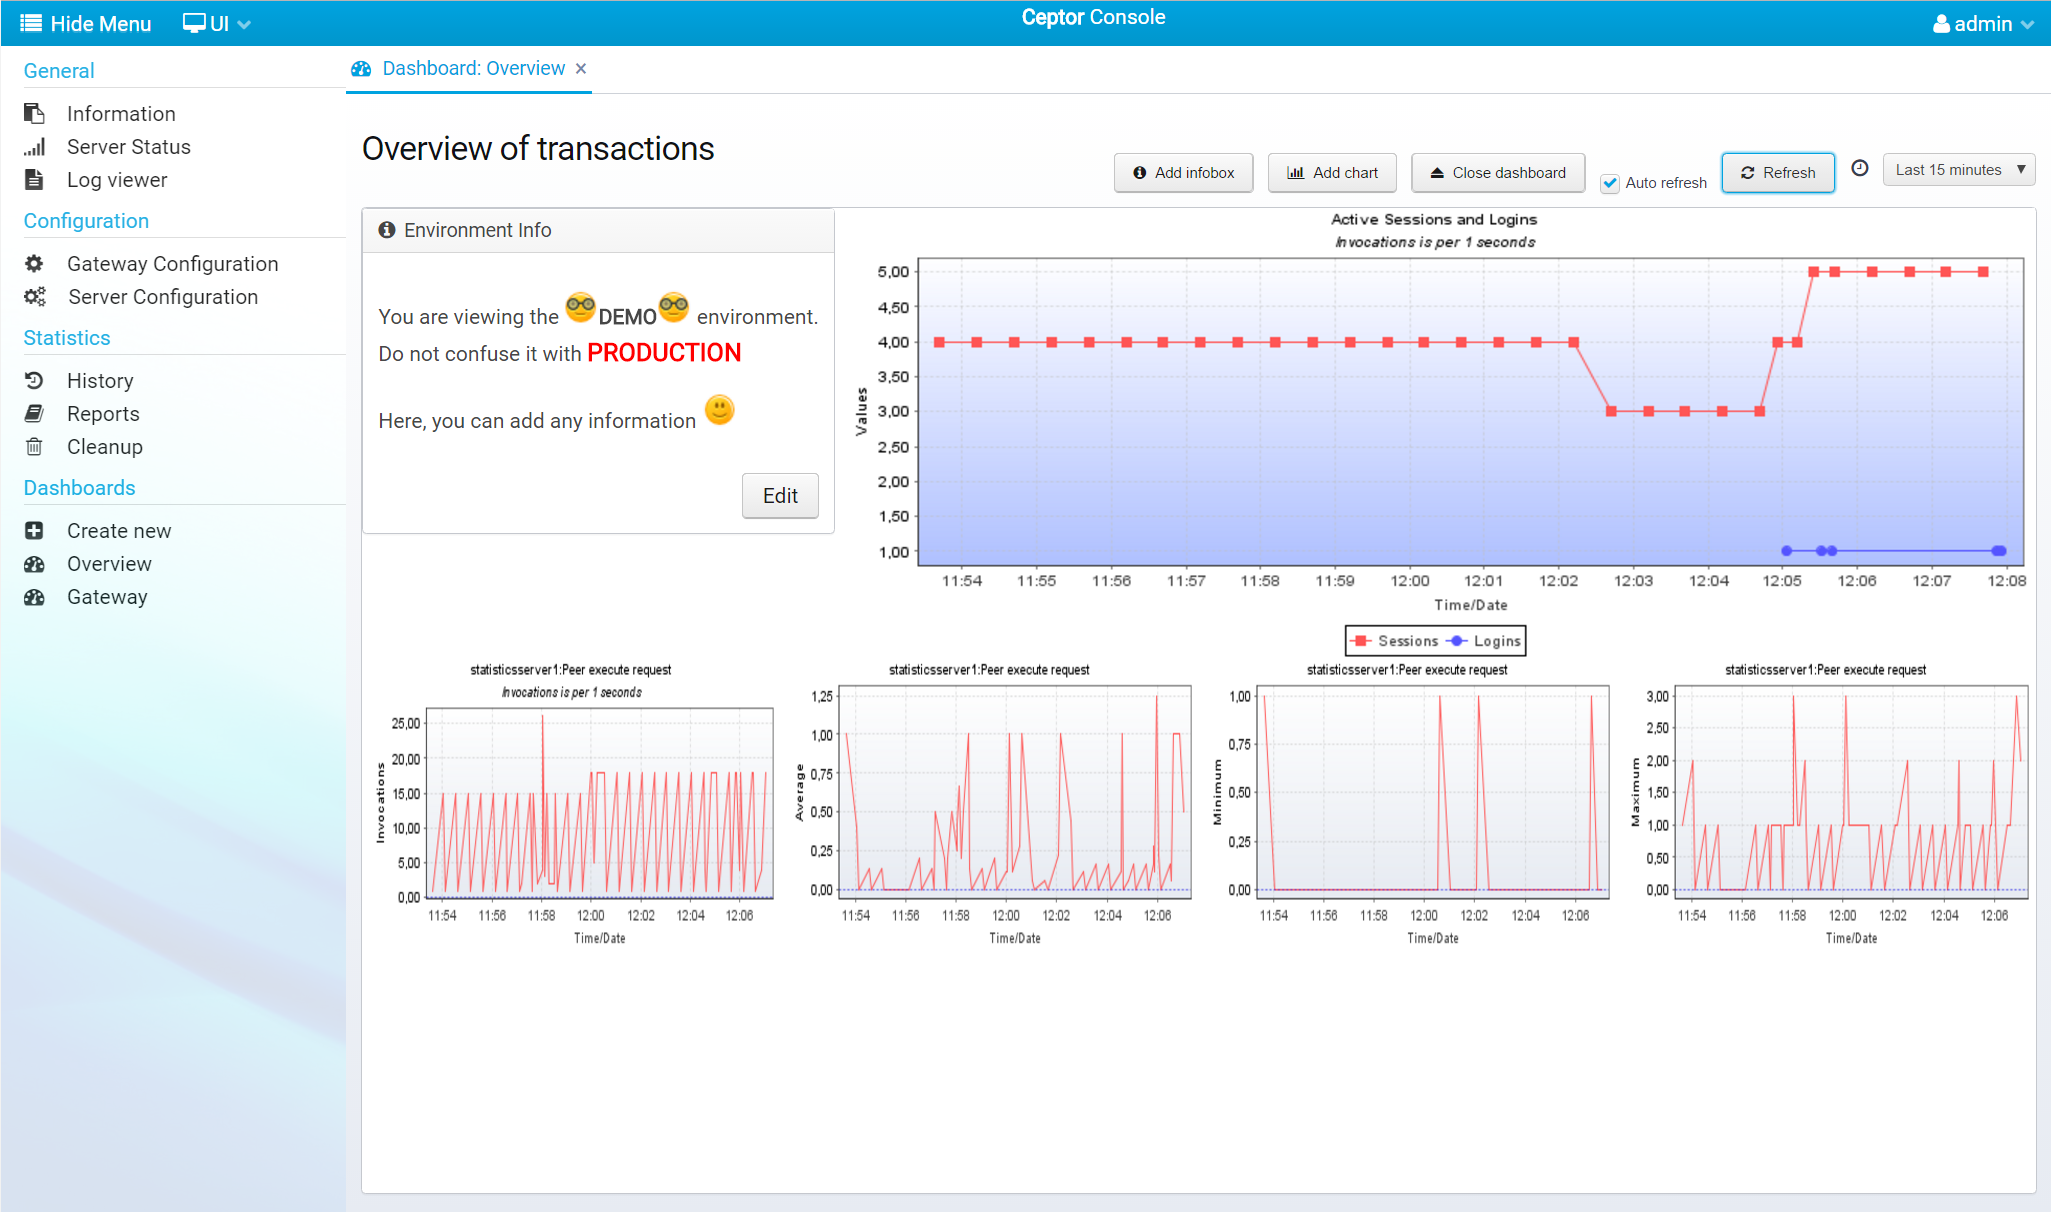
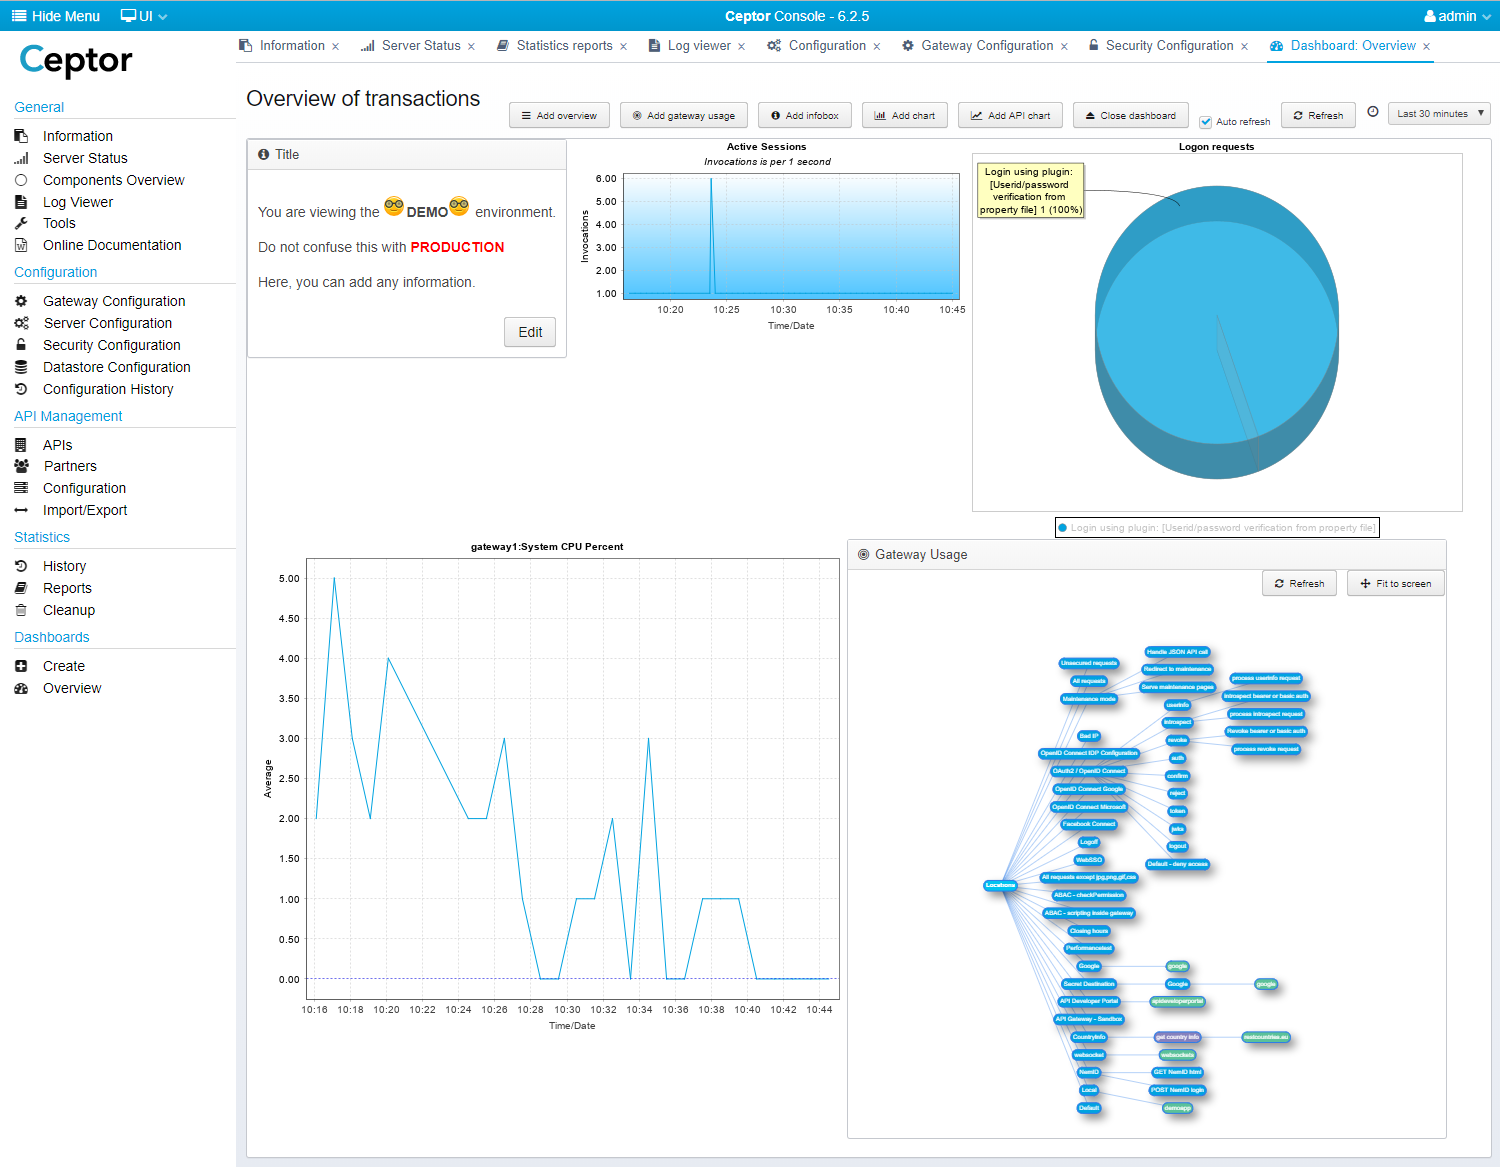
Below is an example dashboard. with an infobox, and 4 a gateway usage diagram, and a few charts charts added.
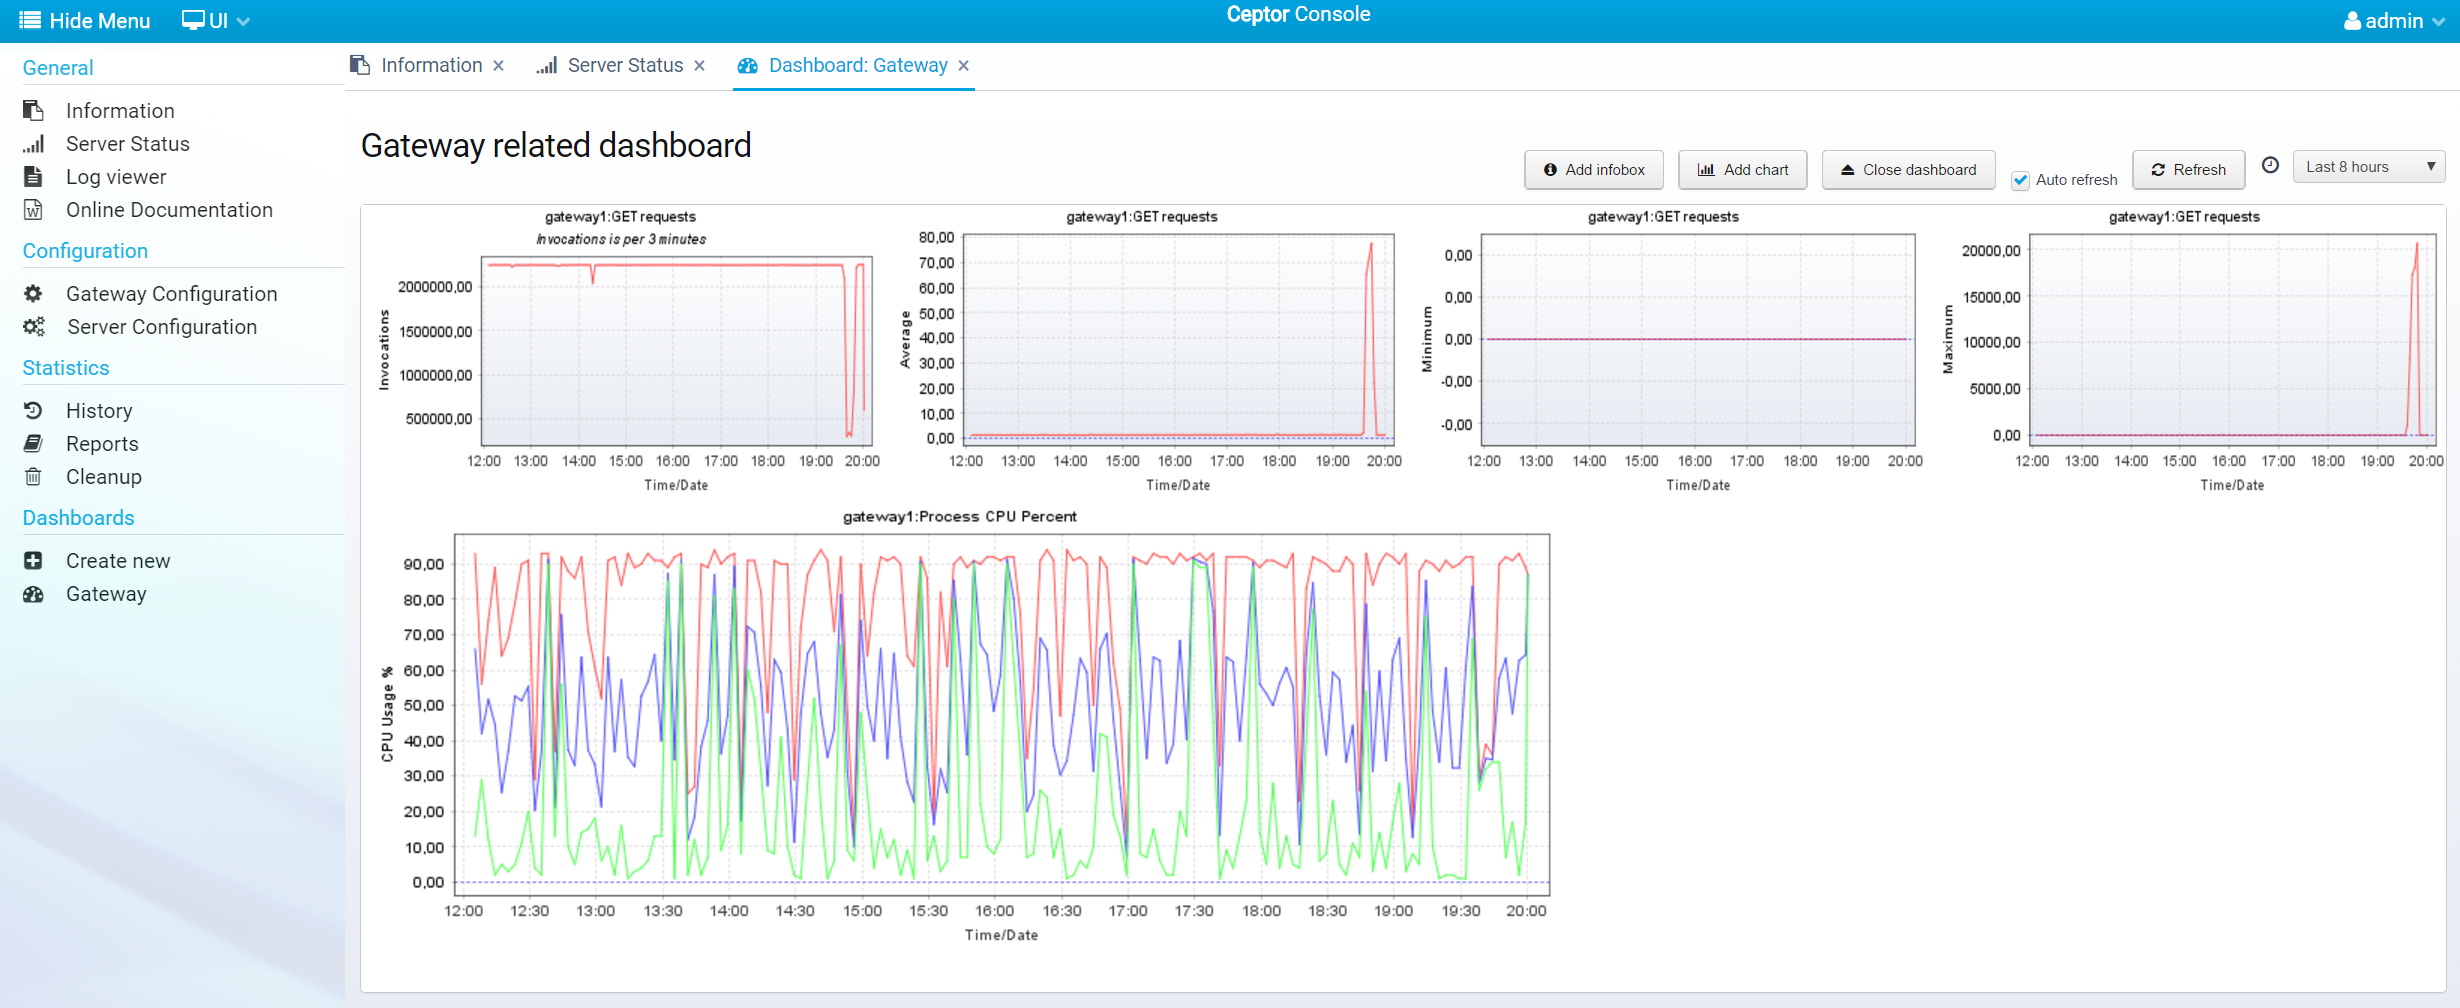
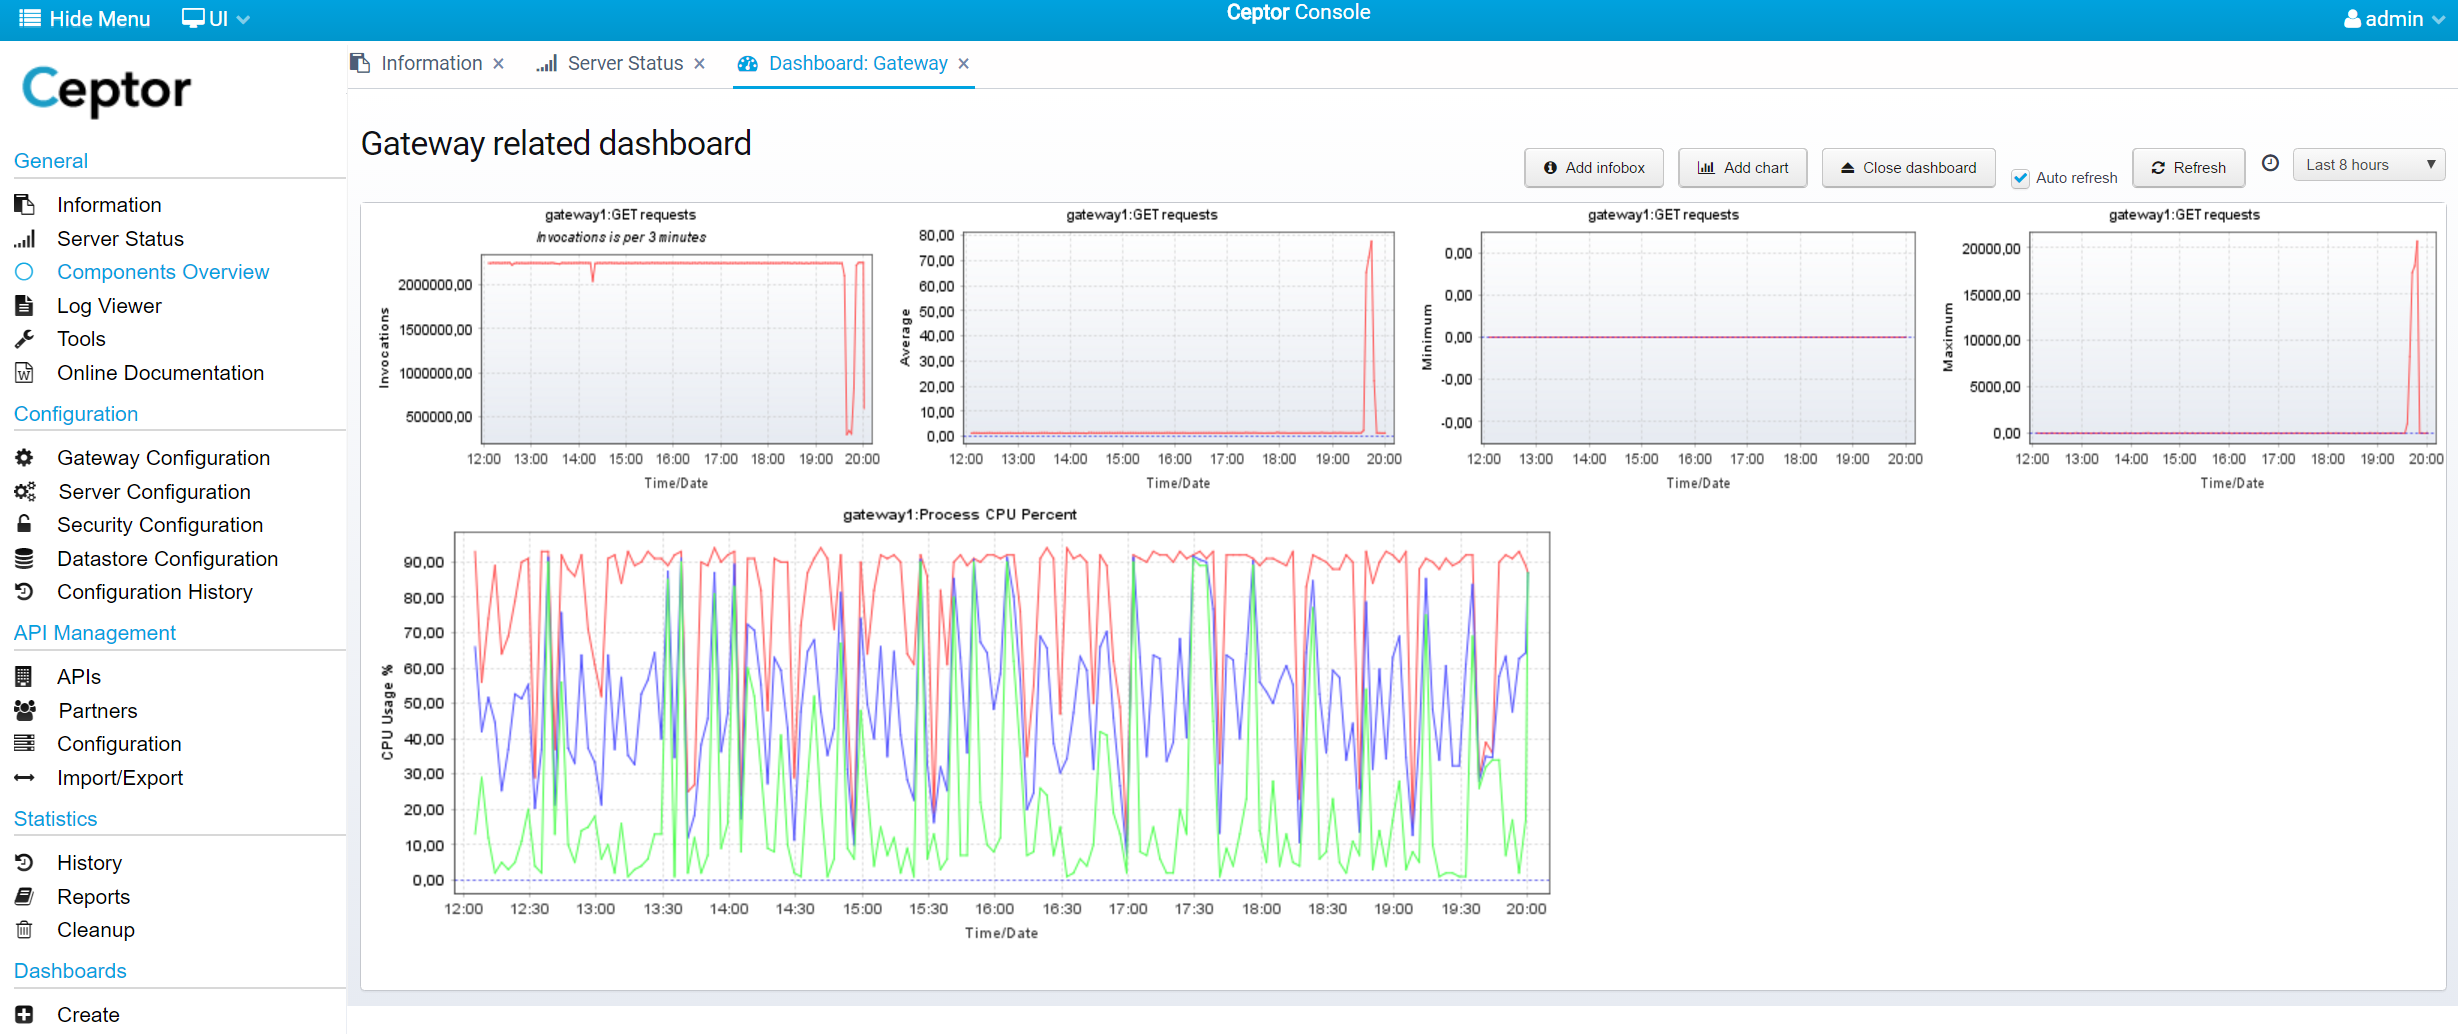
Here is another example, with number of requests, request execution time and CPU usage - the CPU chart has 3 plots defined, for Minimum, Average an Maximum CPU usage respectively.
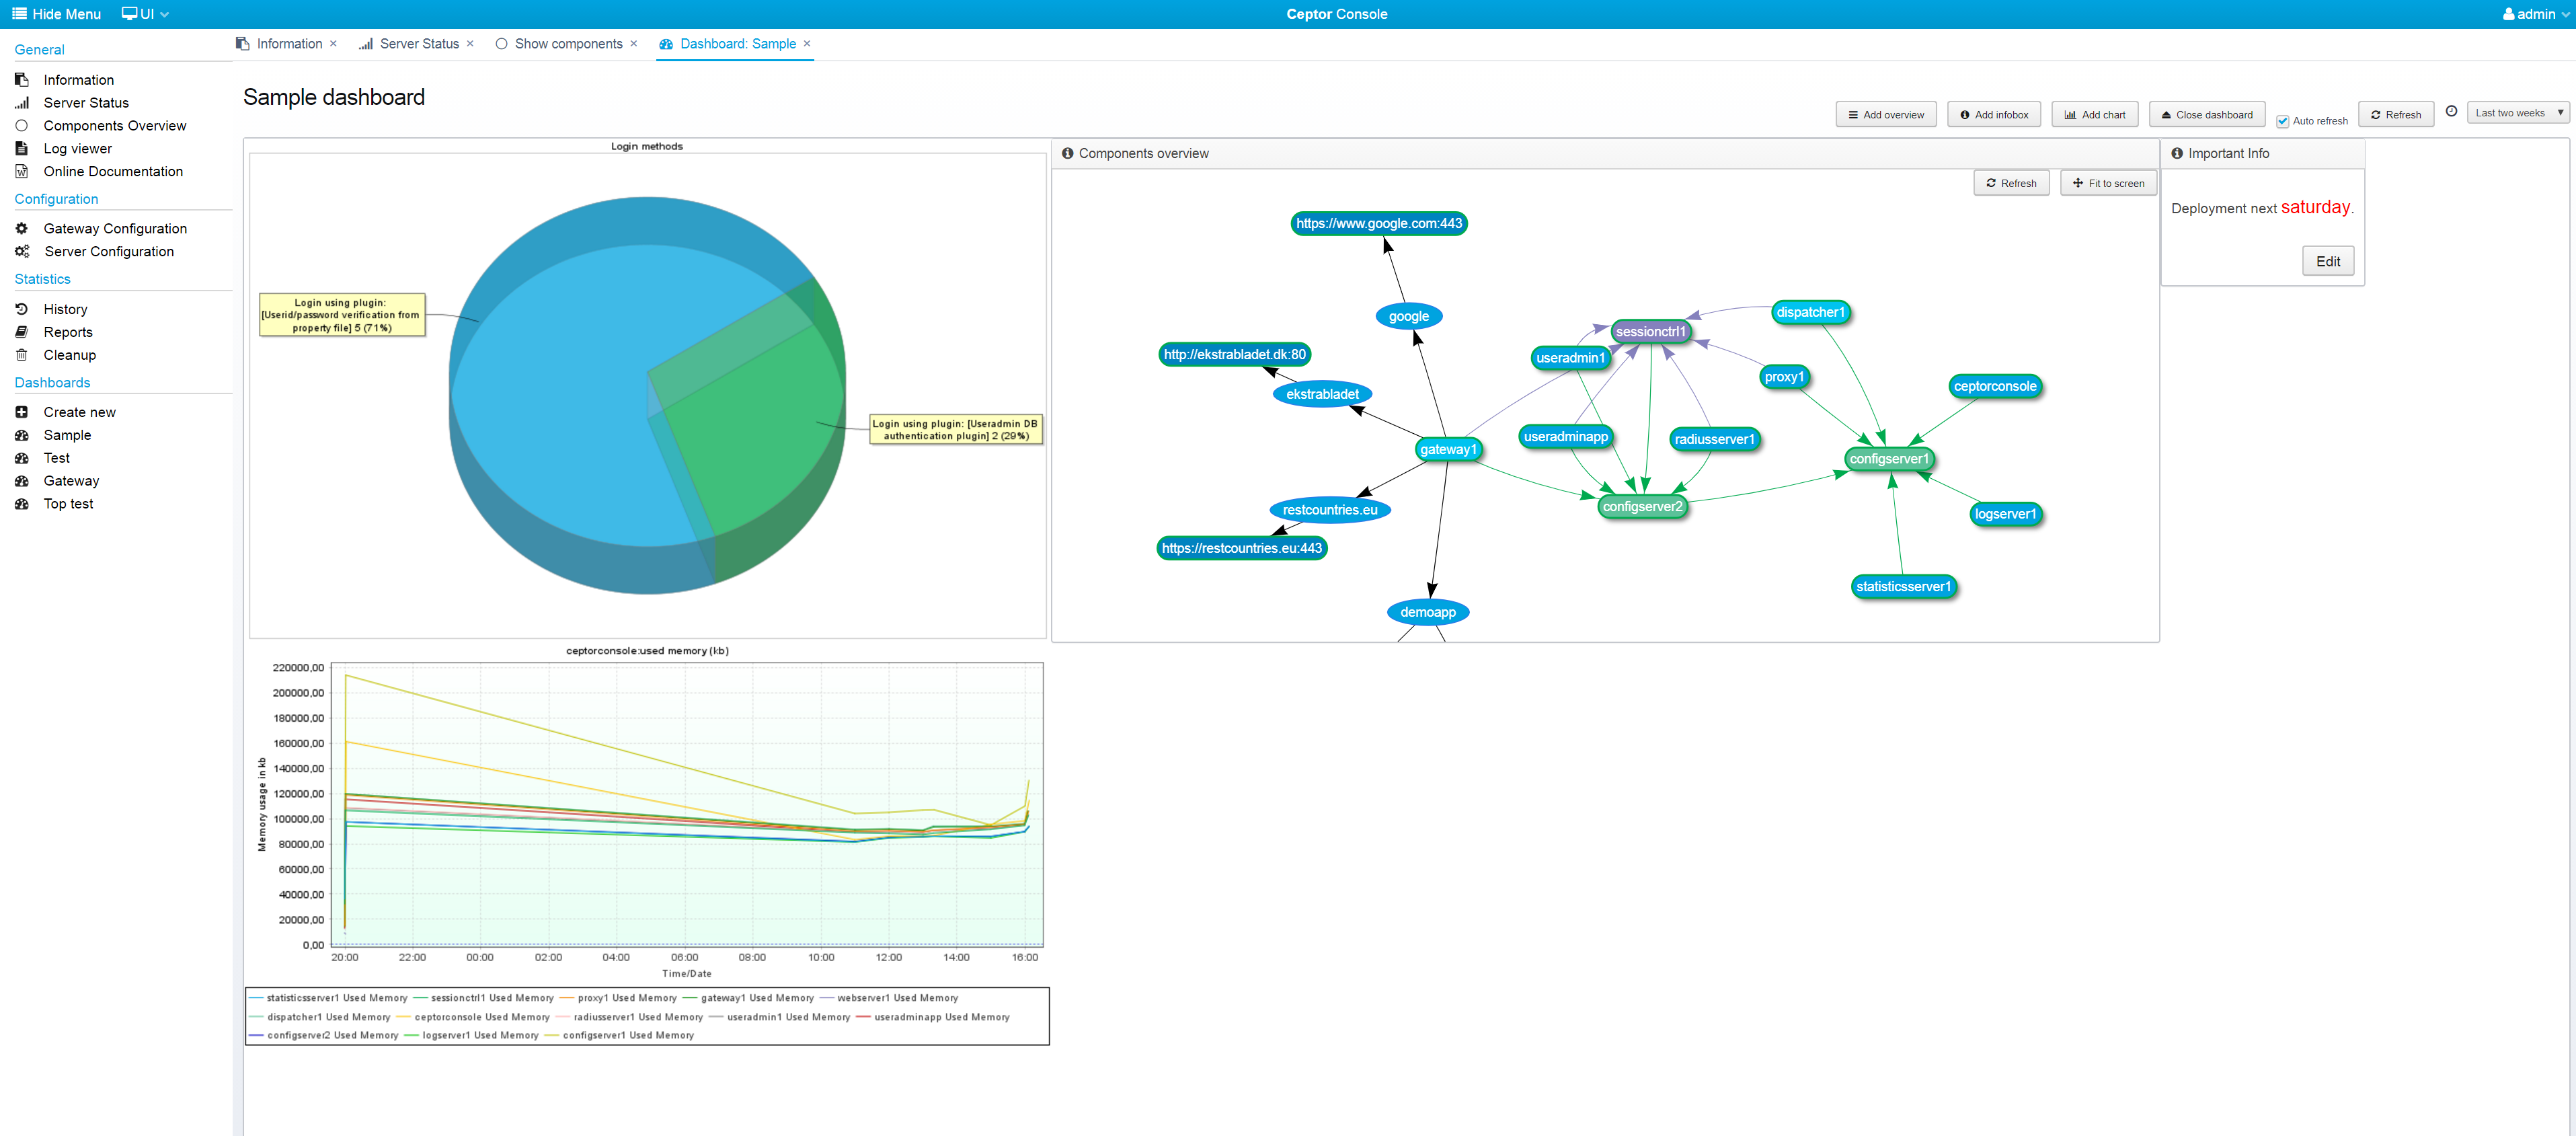
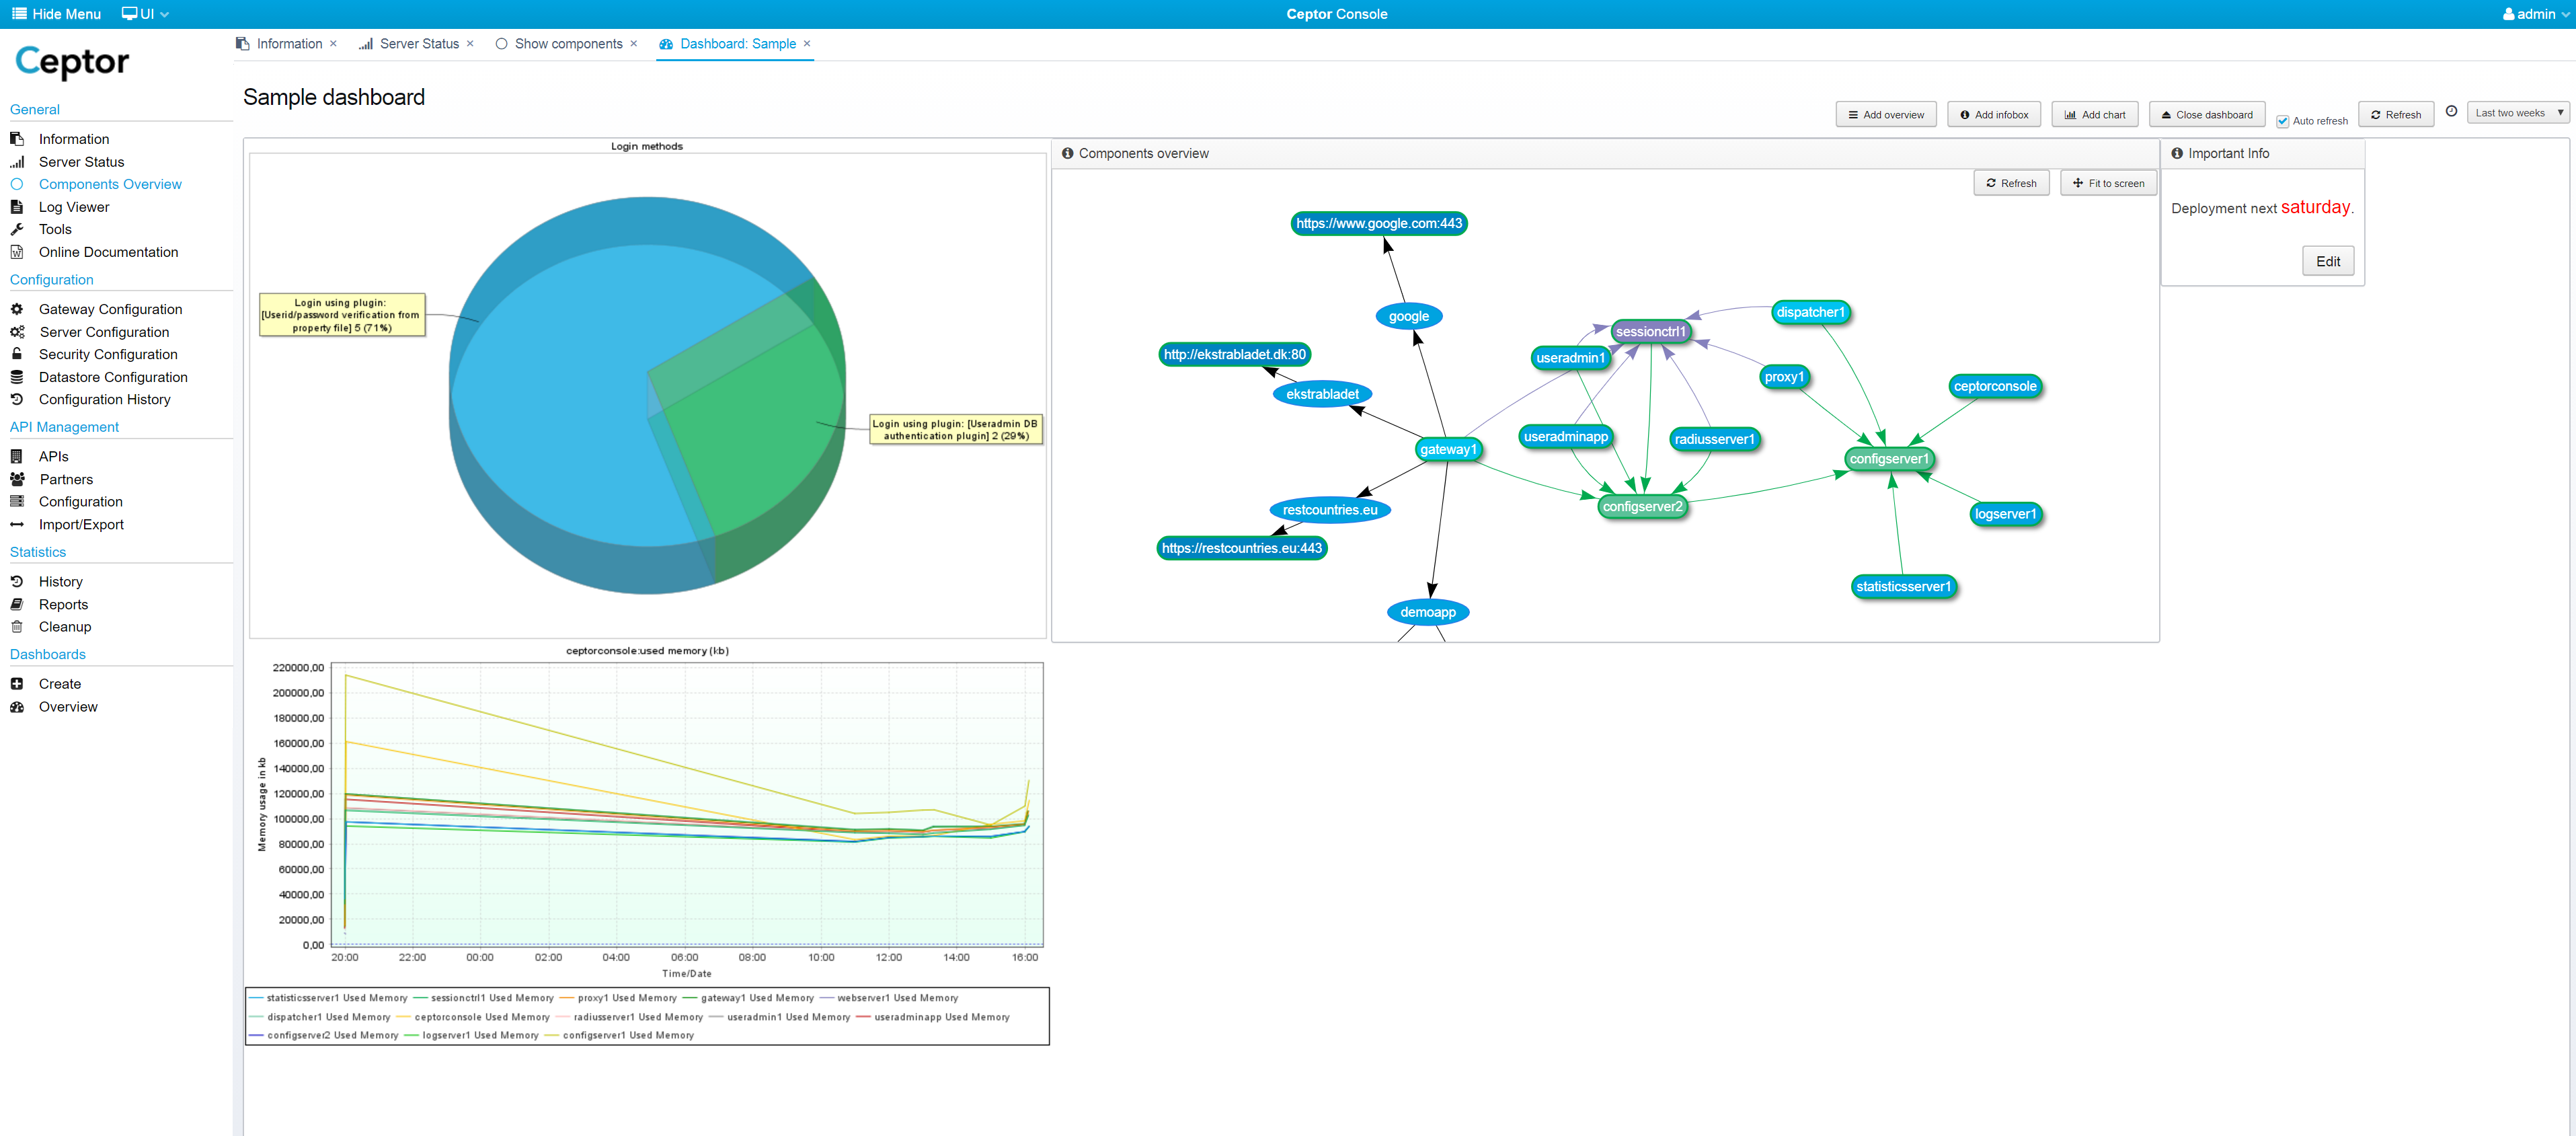
Components Overview
You can add an overview network graph, showing the various components, their status and how they connect to each other - see Components Overview for details.
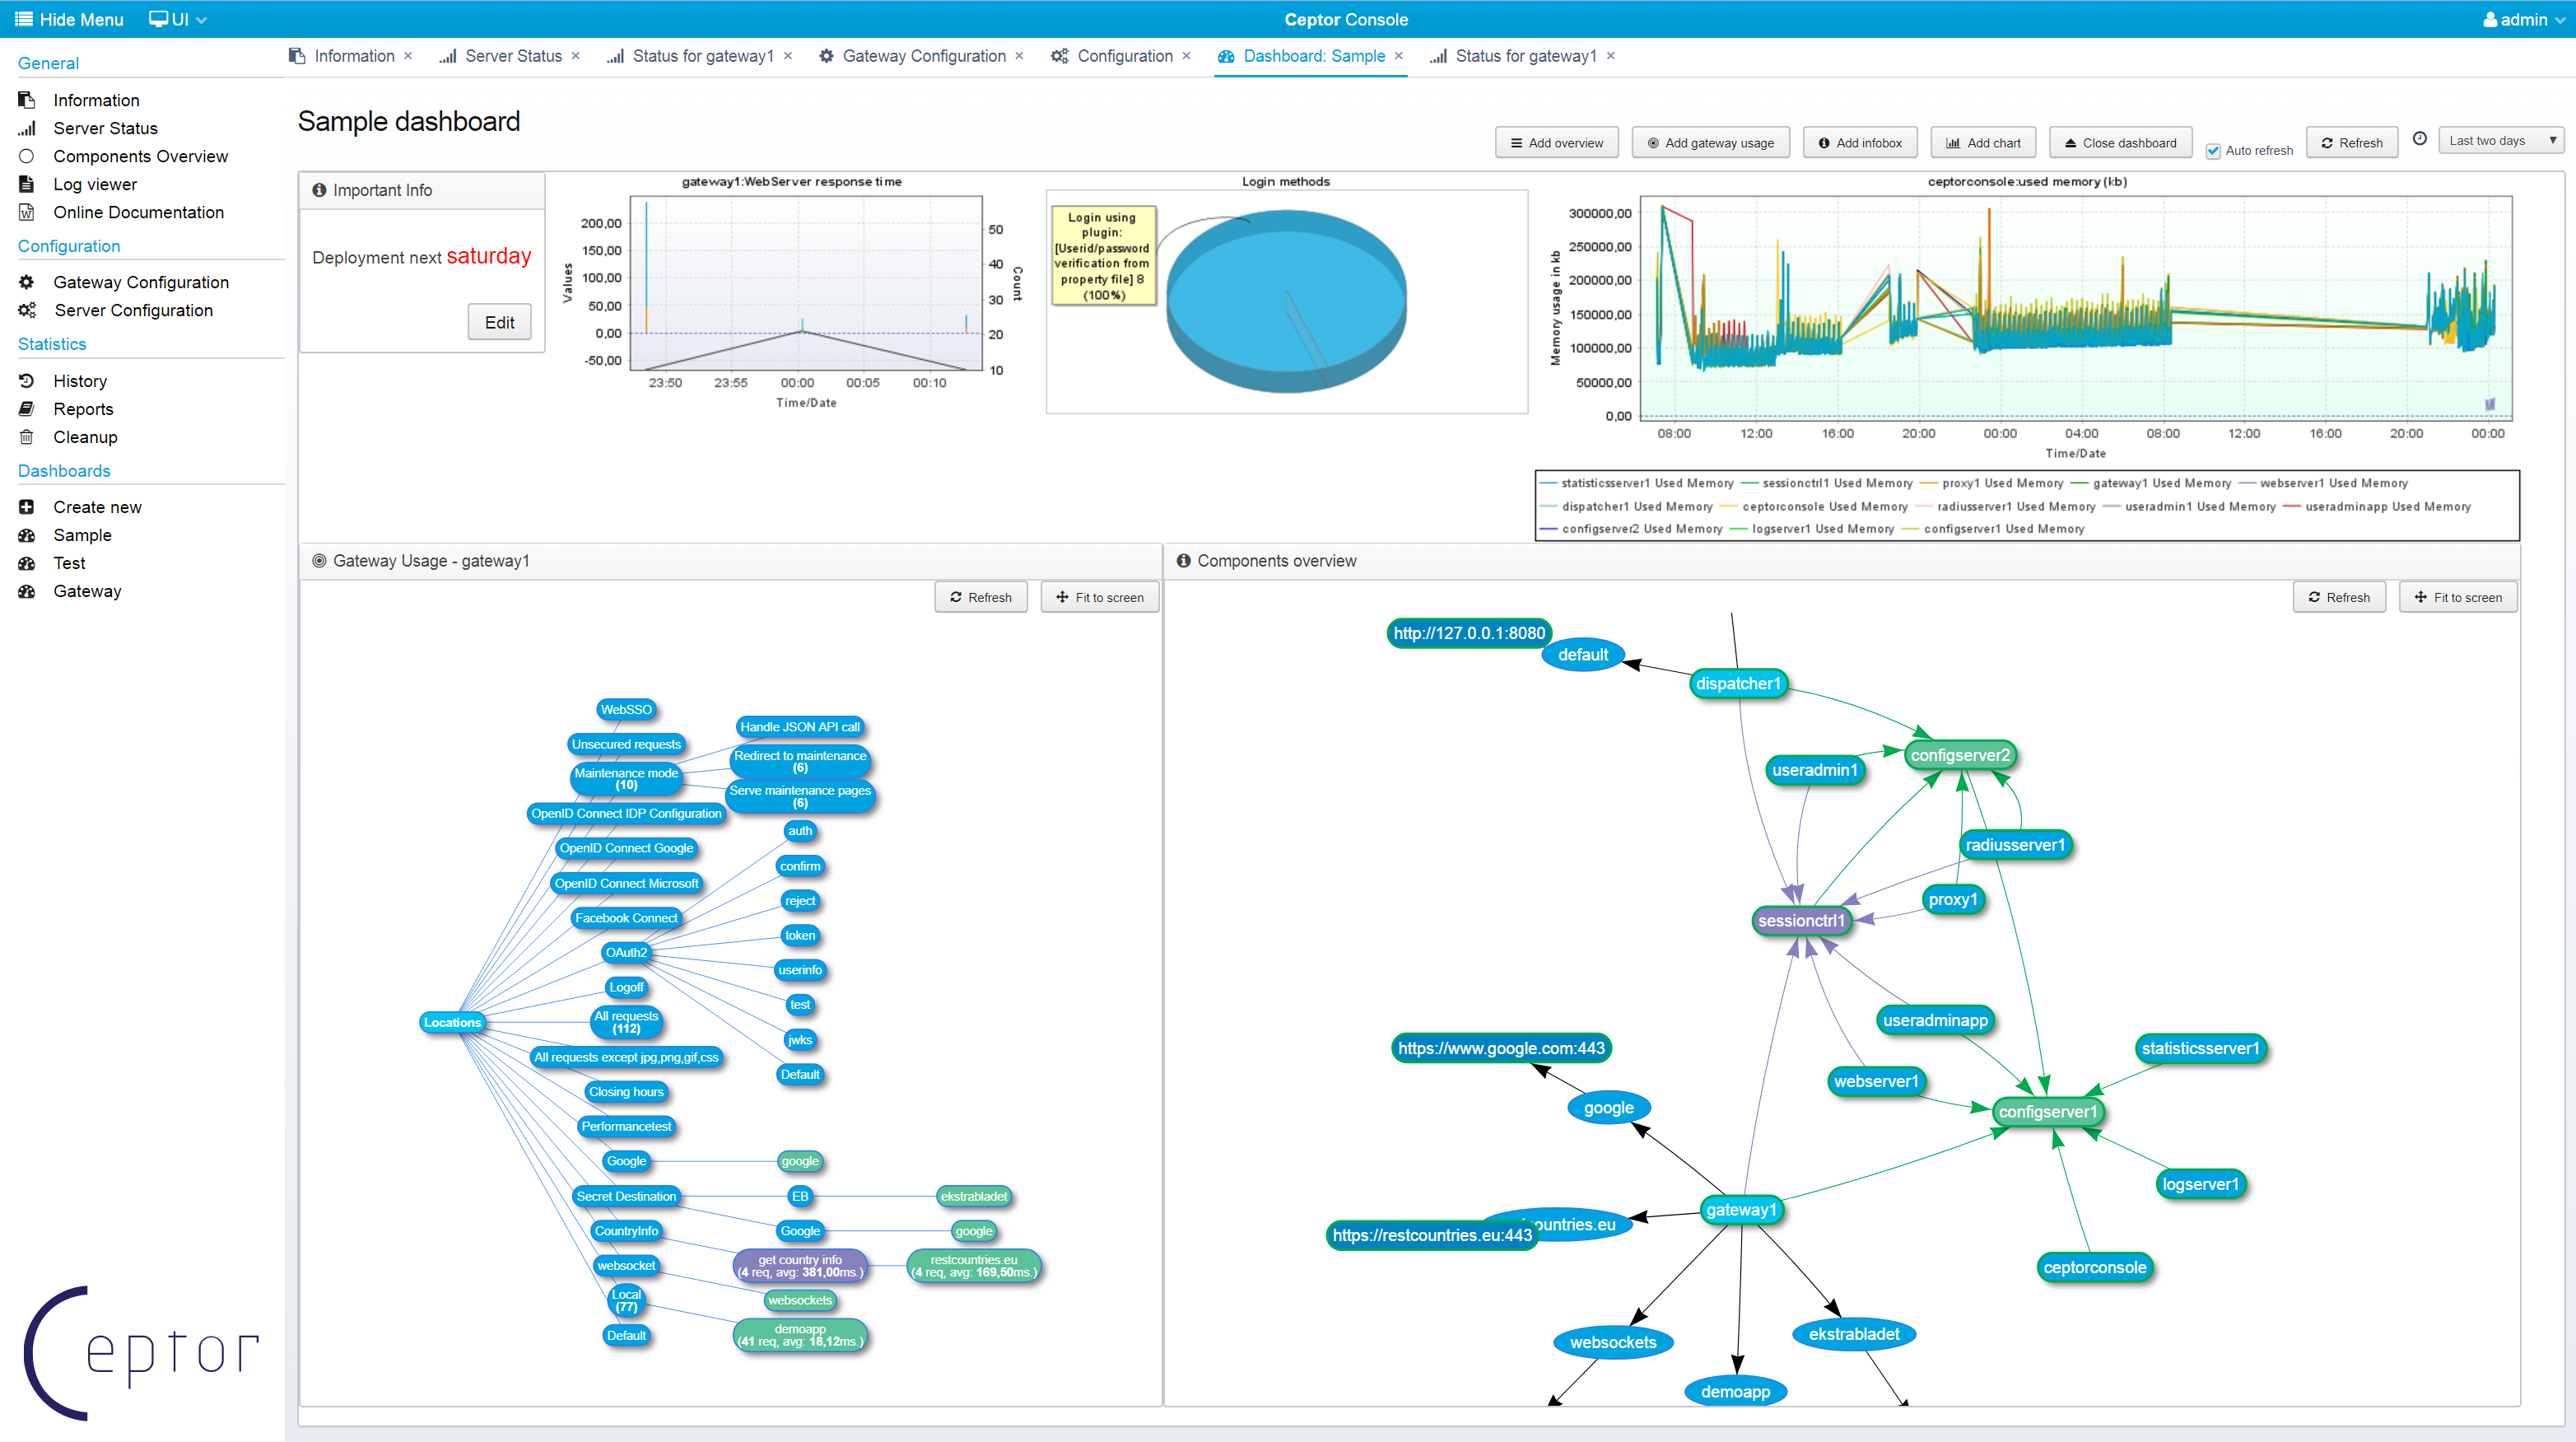
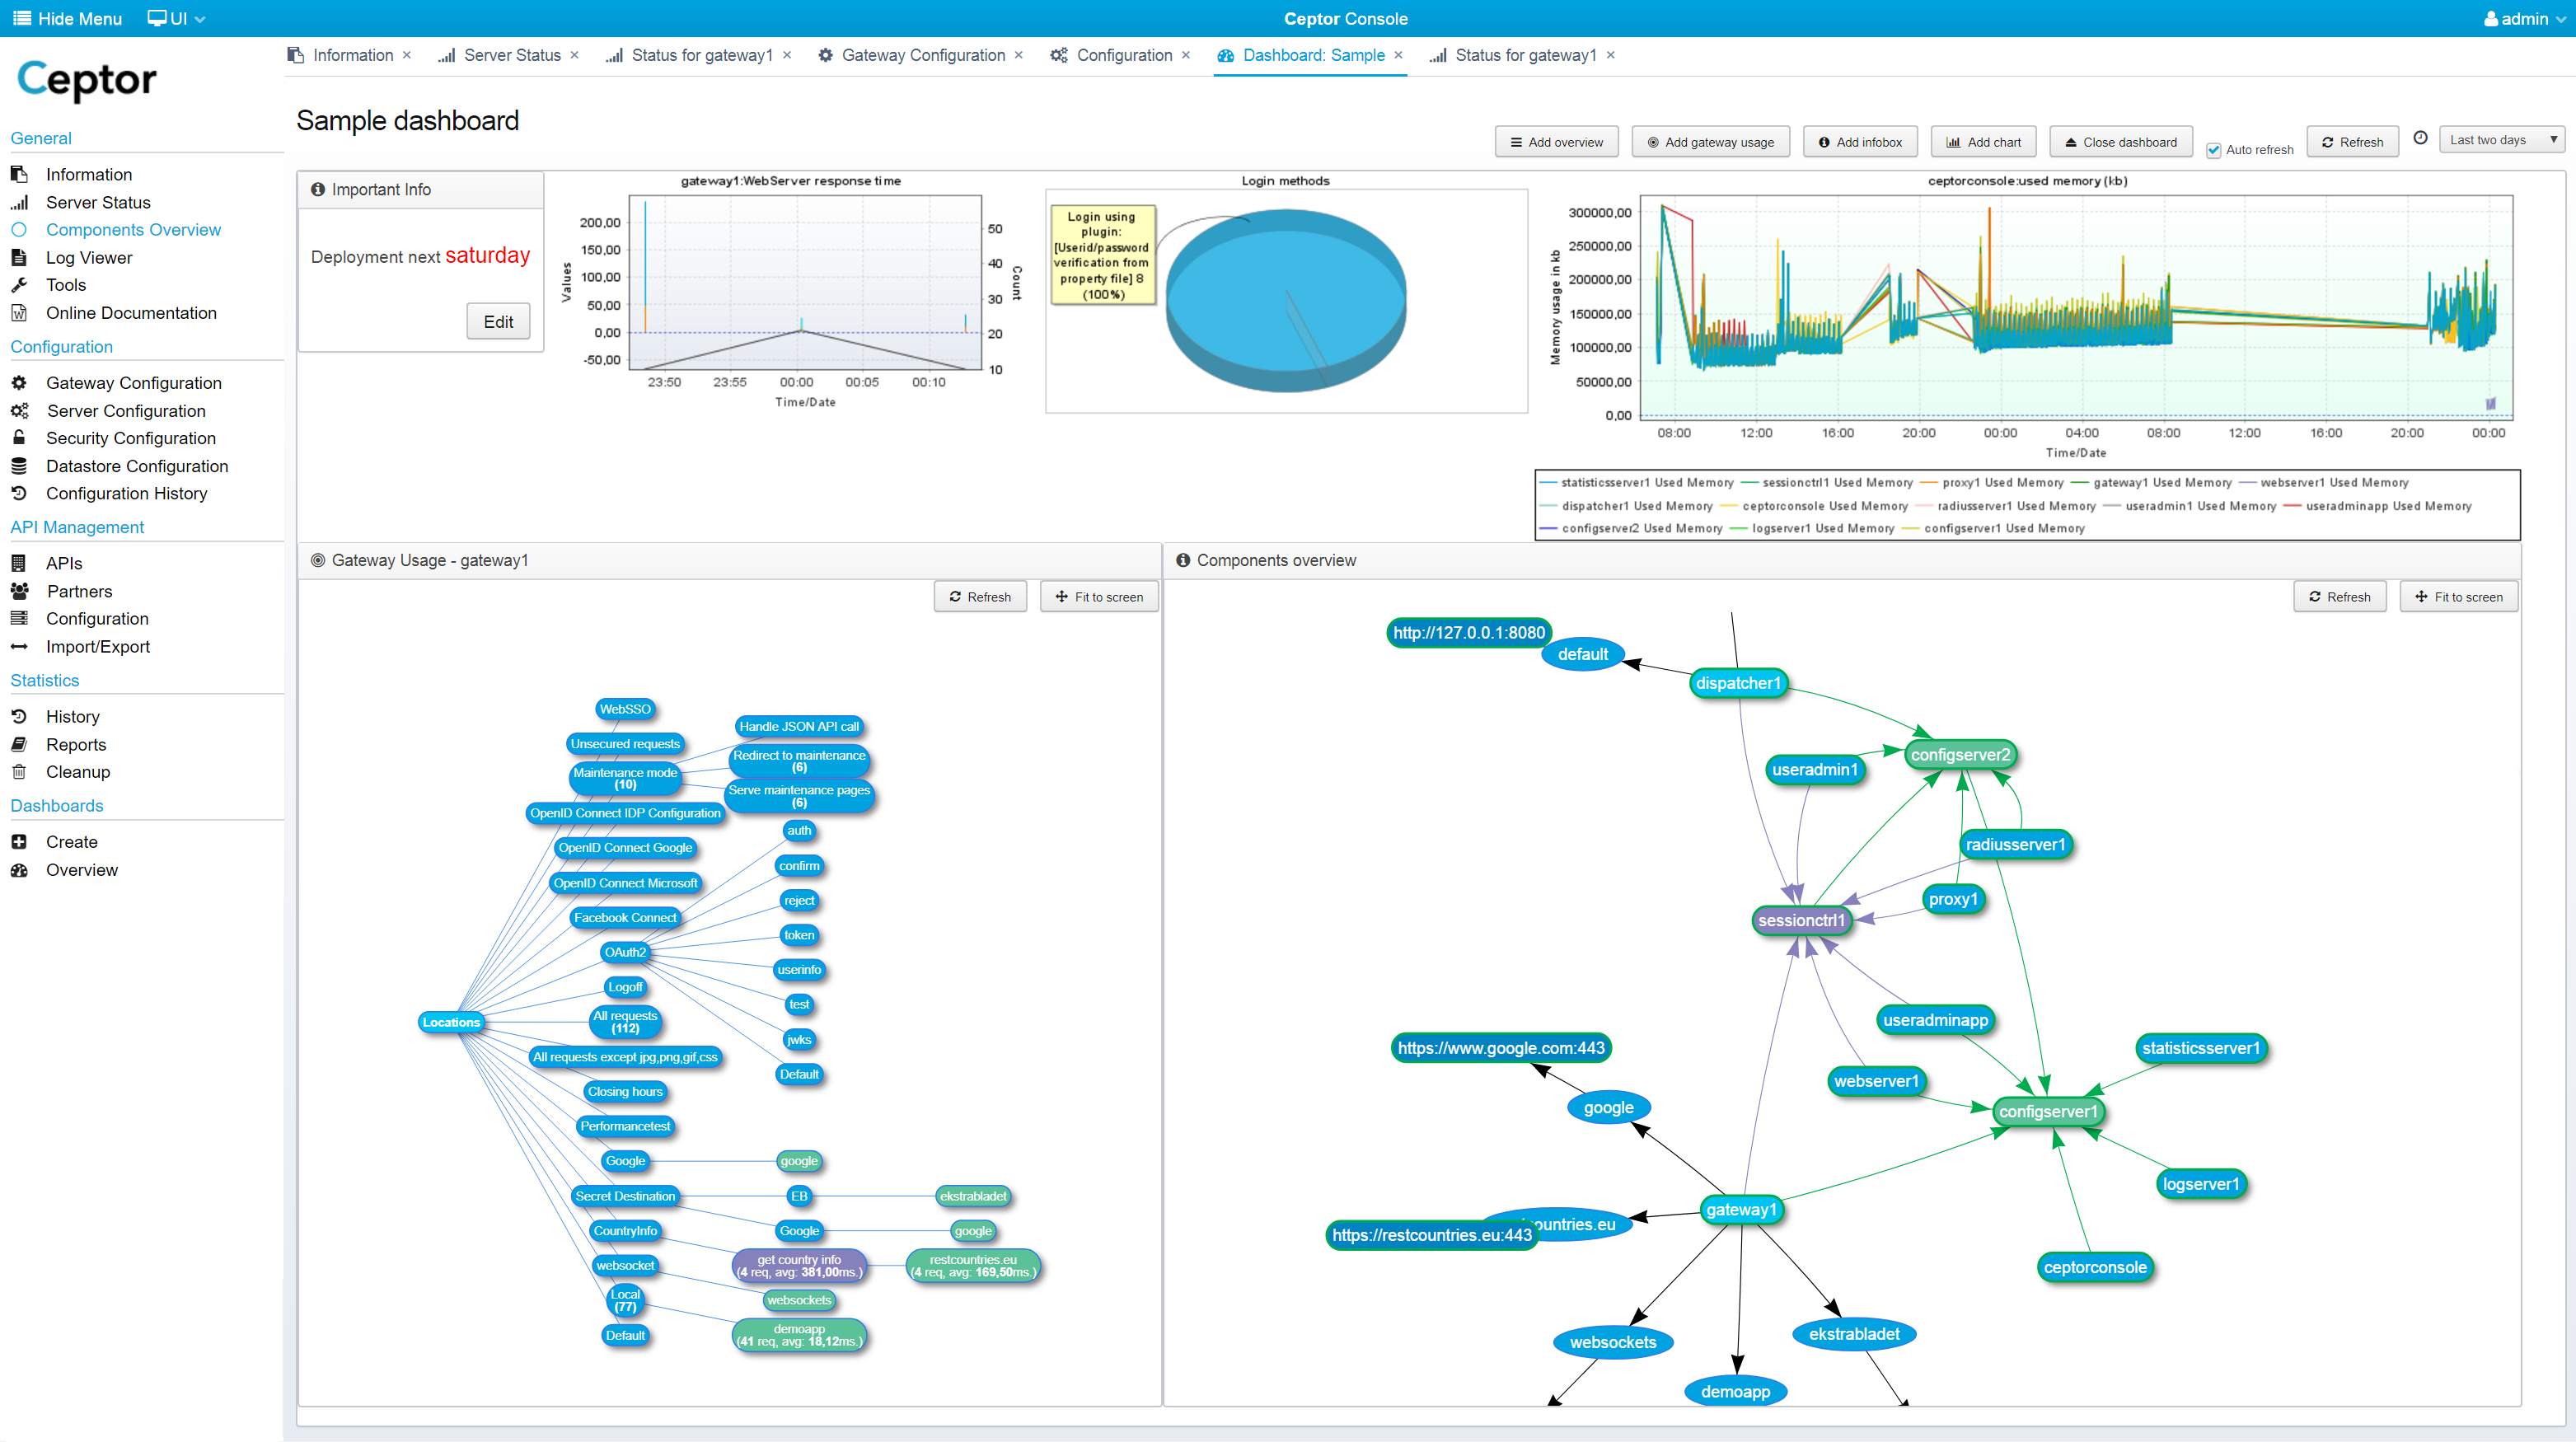
Gateway Usage
You can add a diagram showing the usage of the various locations / pipelines / destinations configured in your gateway - it allows you to easily see which parts are used and how much - you can also see the response time. Double-clicking one of the items lead you to the gateway configuration for that particular location / pipeline / destination.
Below is an example of a dashboard that has both a gateway usage diagram and a components overview diagram added next to each other.
Right-click the diagram to change settings, including which gateway(s) the statistics are taken from - here is an example of specifying multiple gateways - both their statistics will be included in the same diagram.
...
| Tip |
|---|
When using Ceptor API Management you should configure the Ceptor API Gateway /wiki/spaces/CEPTORINTERNAL/pages/982876769 to store API Usage data in Elasticsearch - see API Usage / Analytics and Setting up API Gateway for more information on how to do this. |
...