...
This will give you a page like this, where you can browse through all the recorded statistics and filter it by entering values in "Server Filter" or "Function Filter".
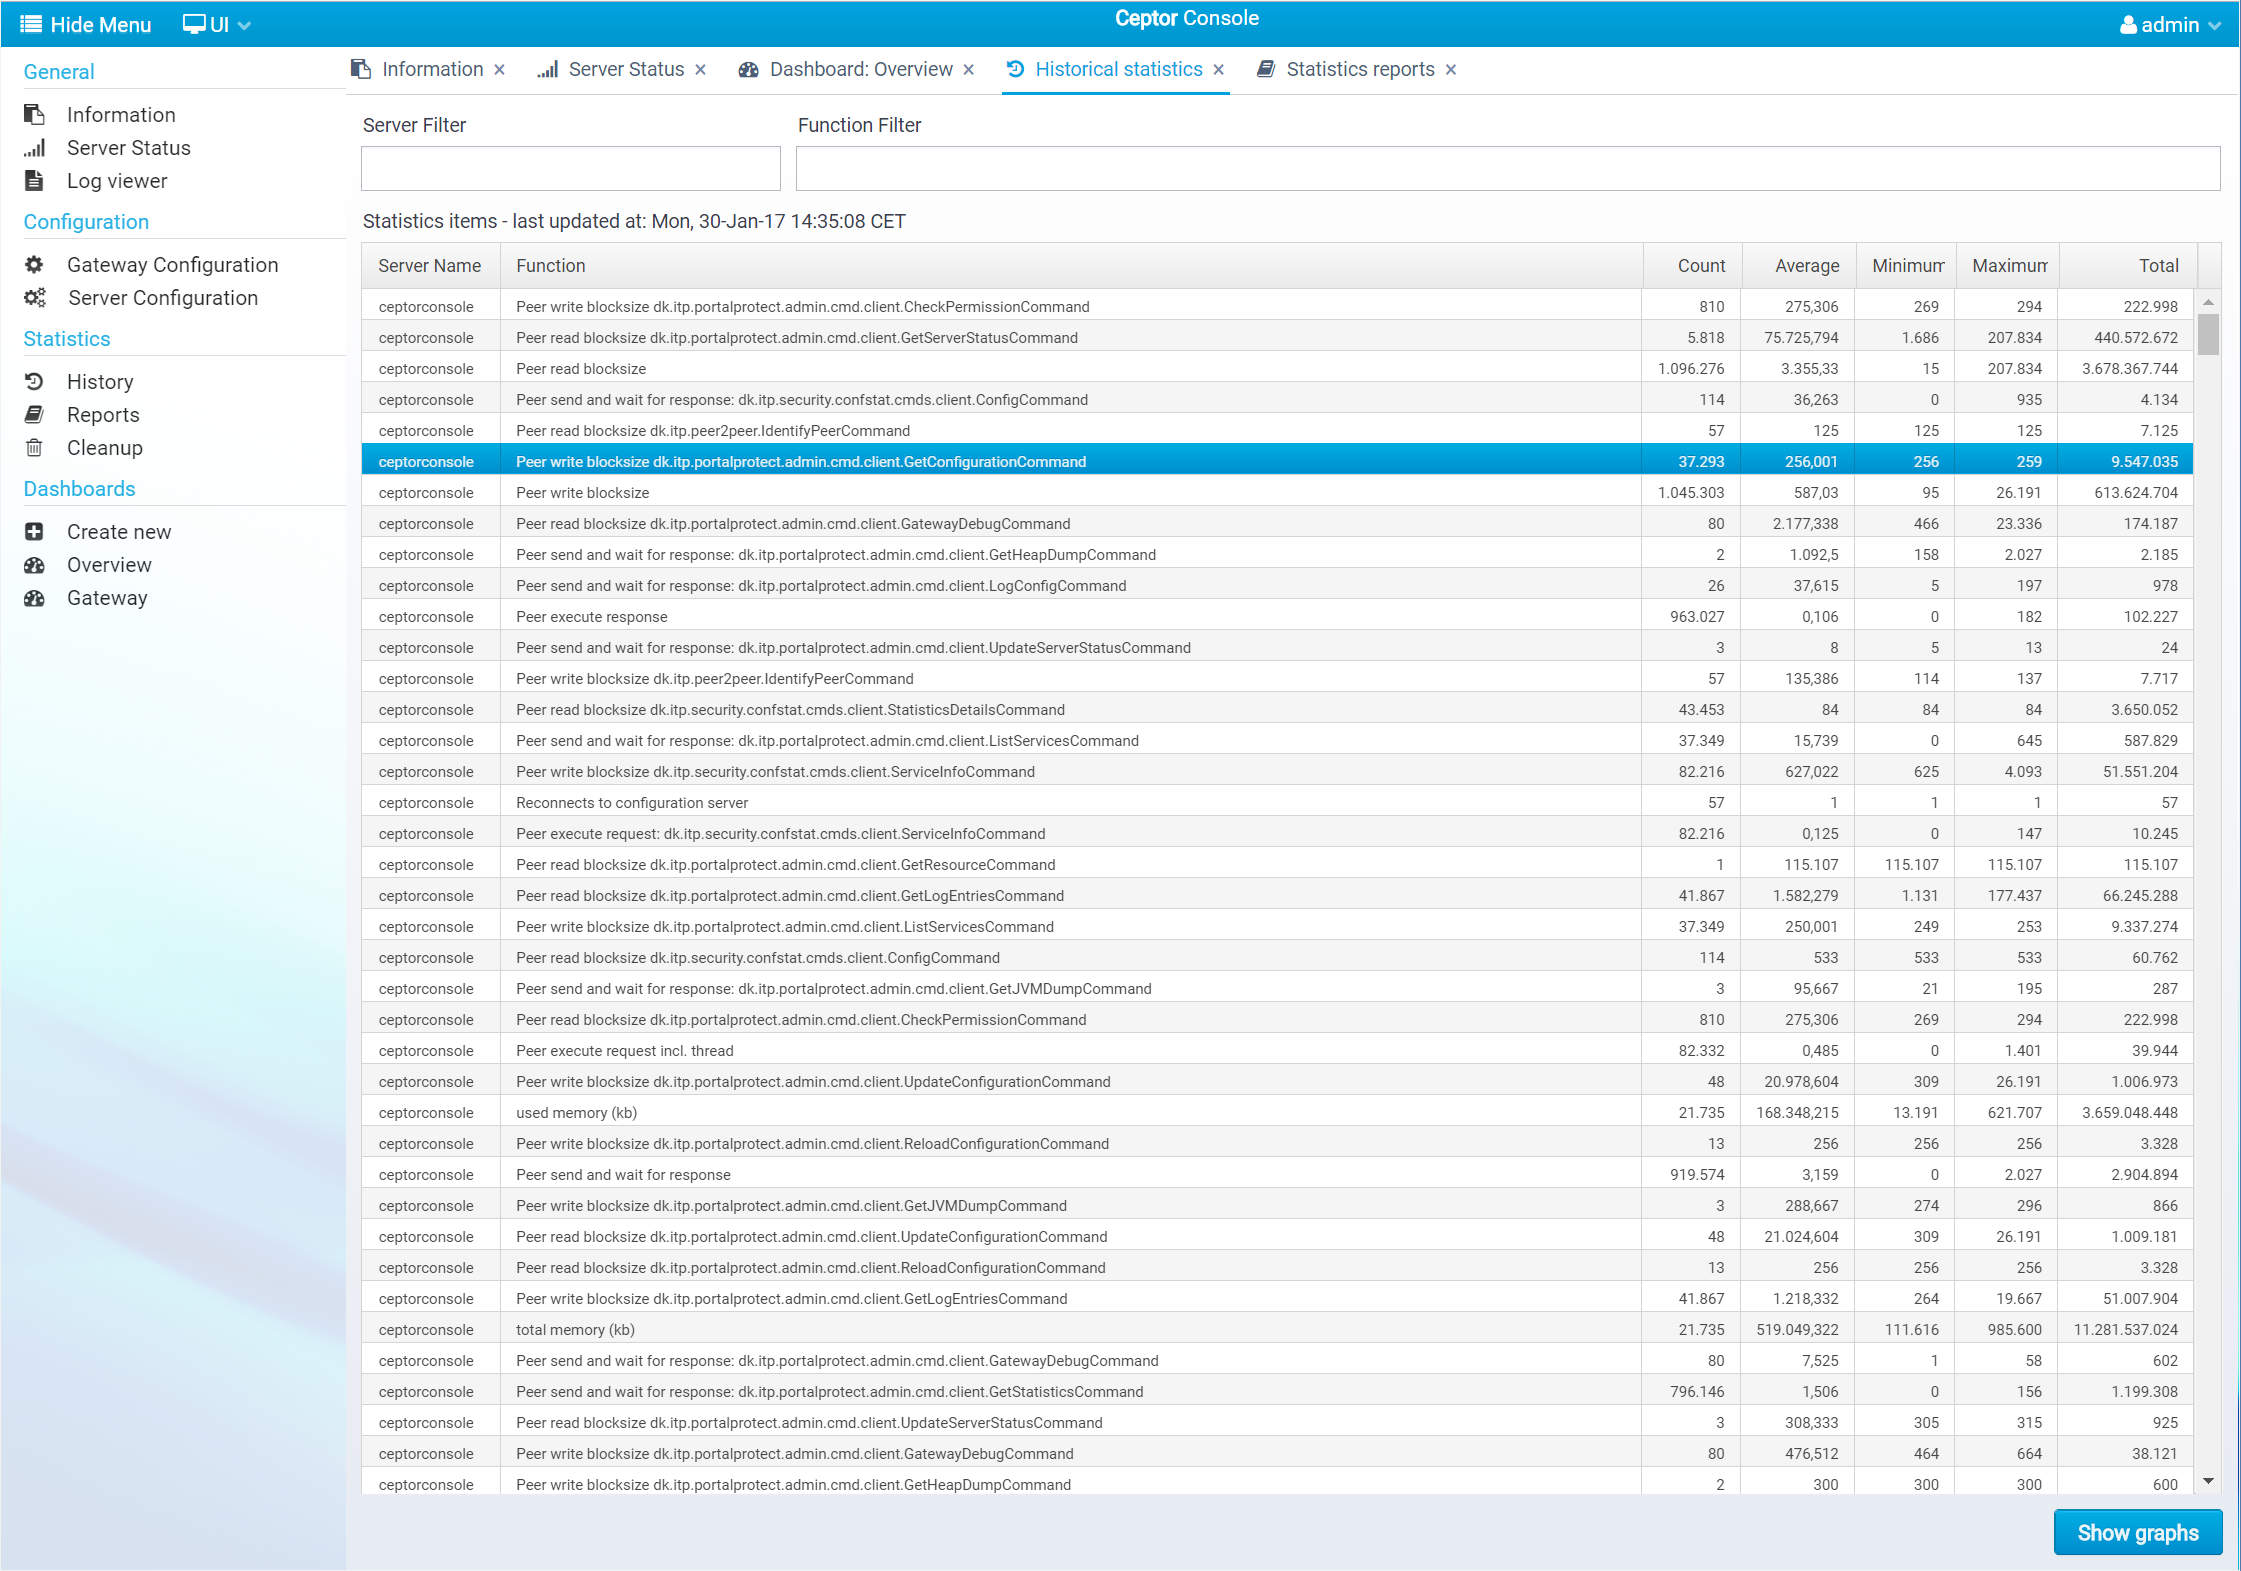
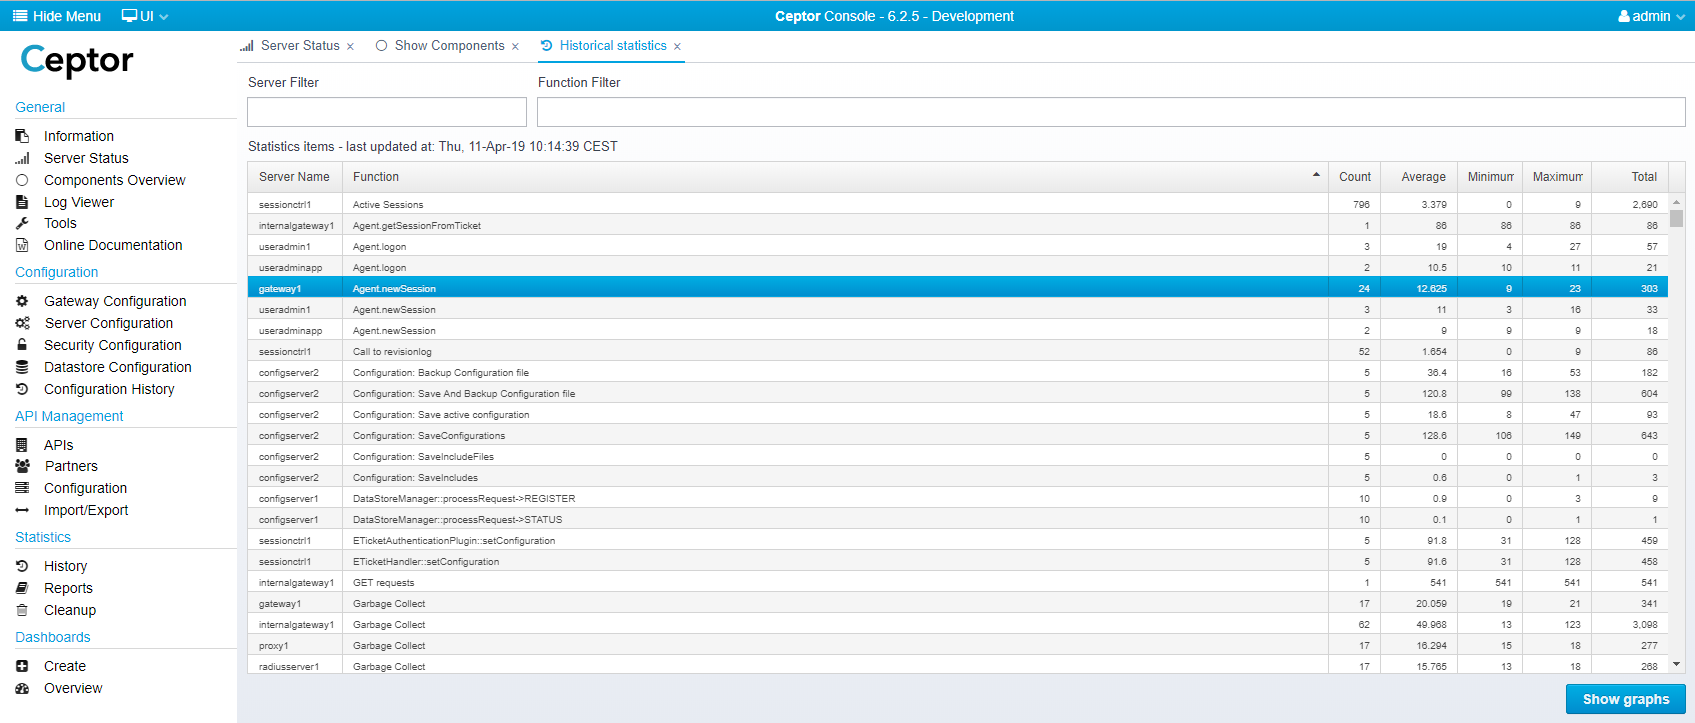
If you want to view a graph of the measurements made, select a line and press "Show Graphs" - you will then get this dialog:
...
If you select "Reports" from the statistics menu, you get to this screen:
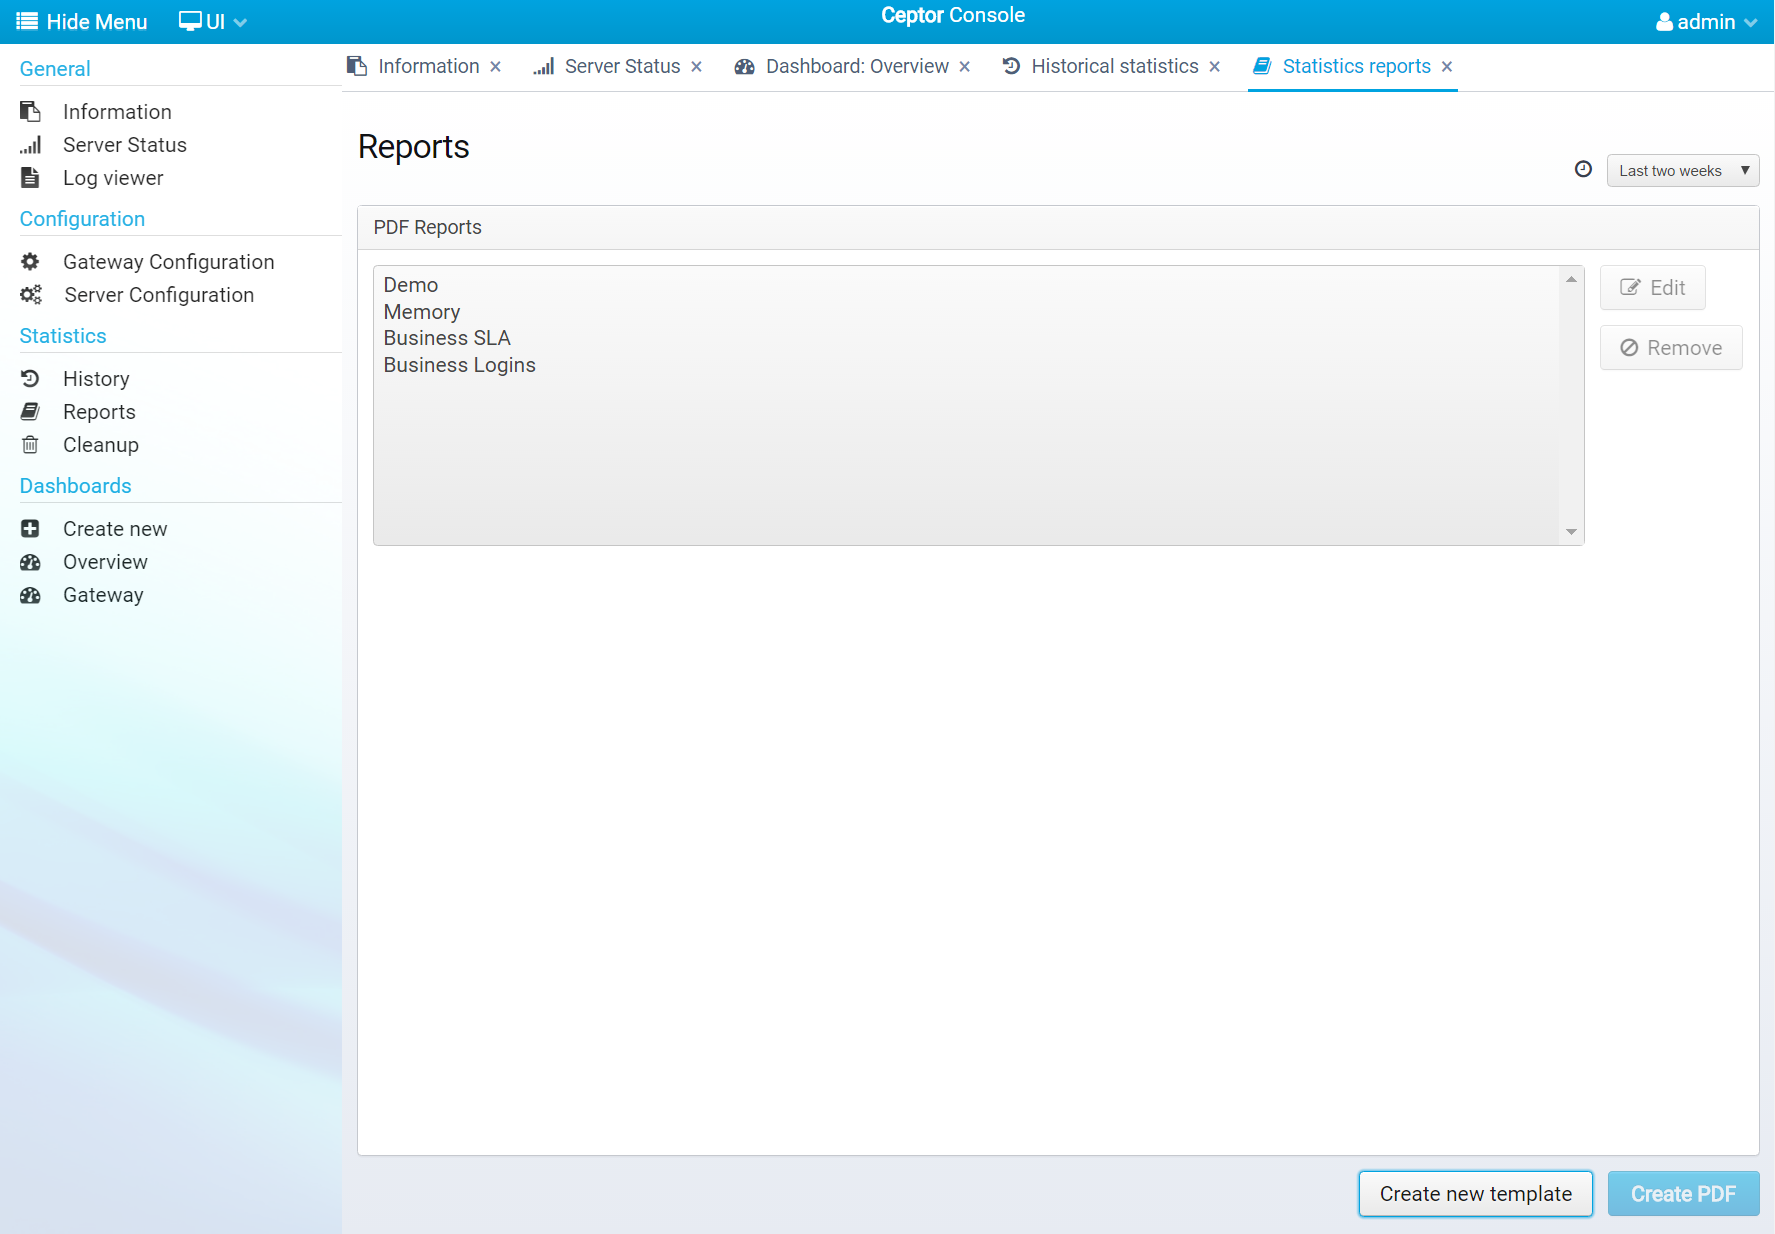
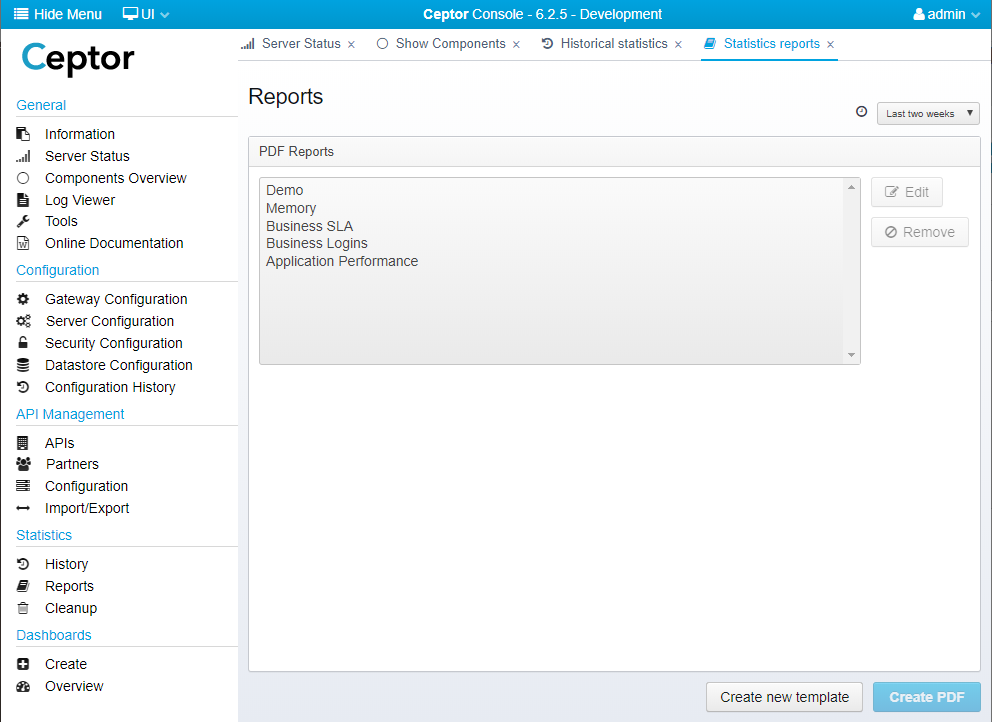
Here, you can select an existing template, and create a PDF from it - select the time interval you want up in the top right corner.
You can use an existing template, or create a new one, you can also edit an existing template:
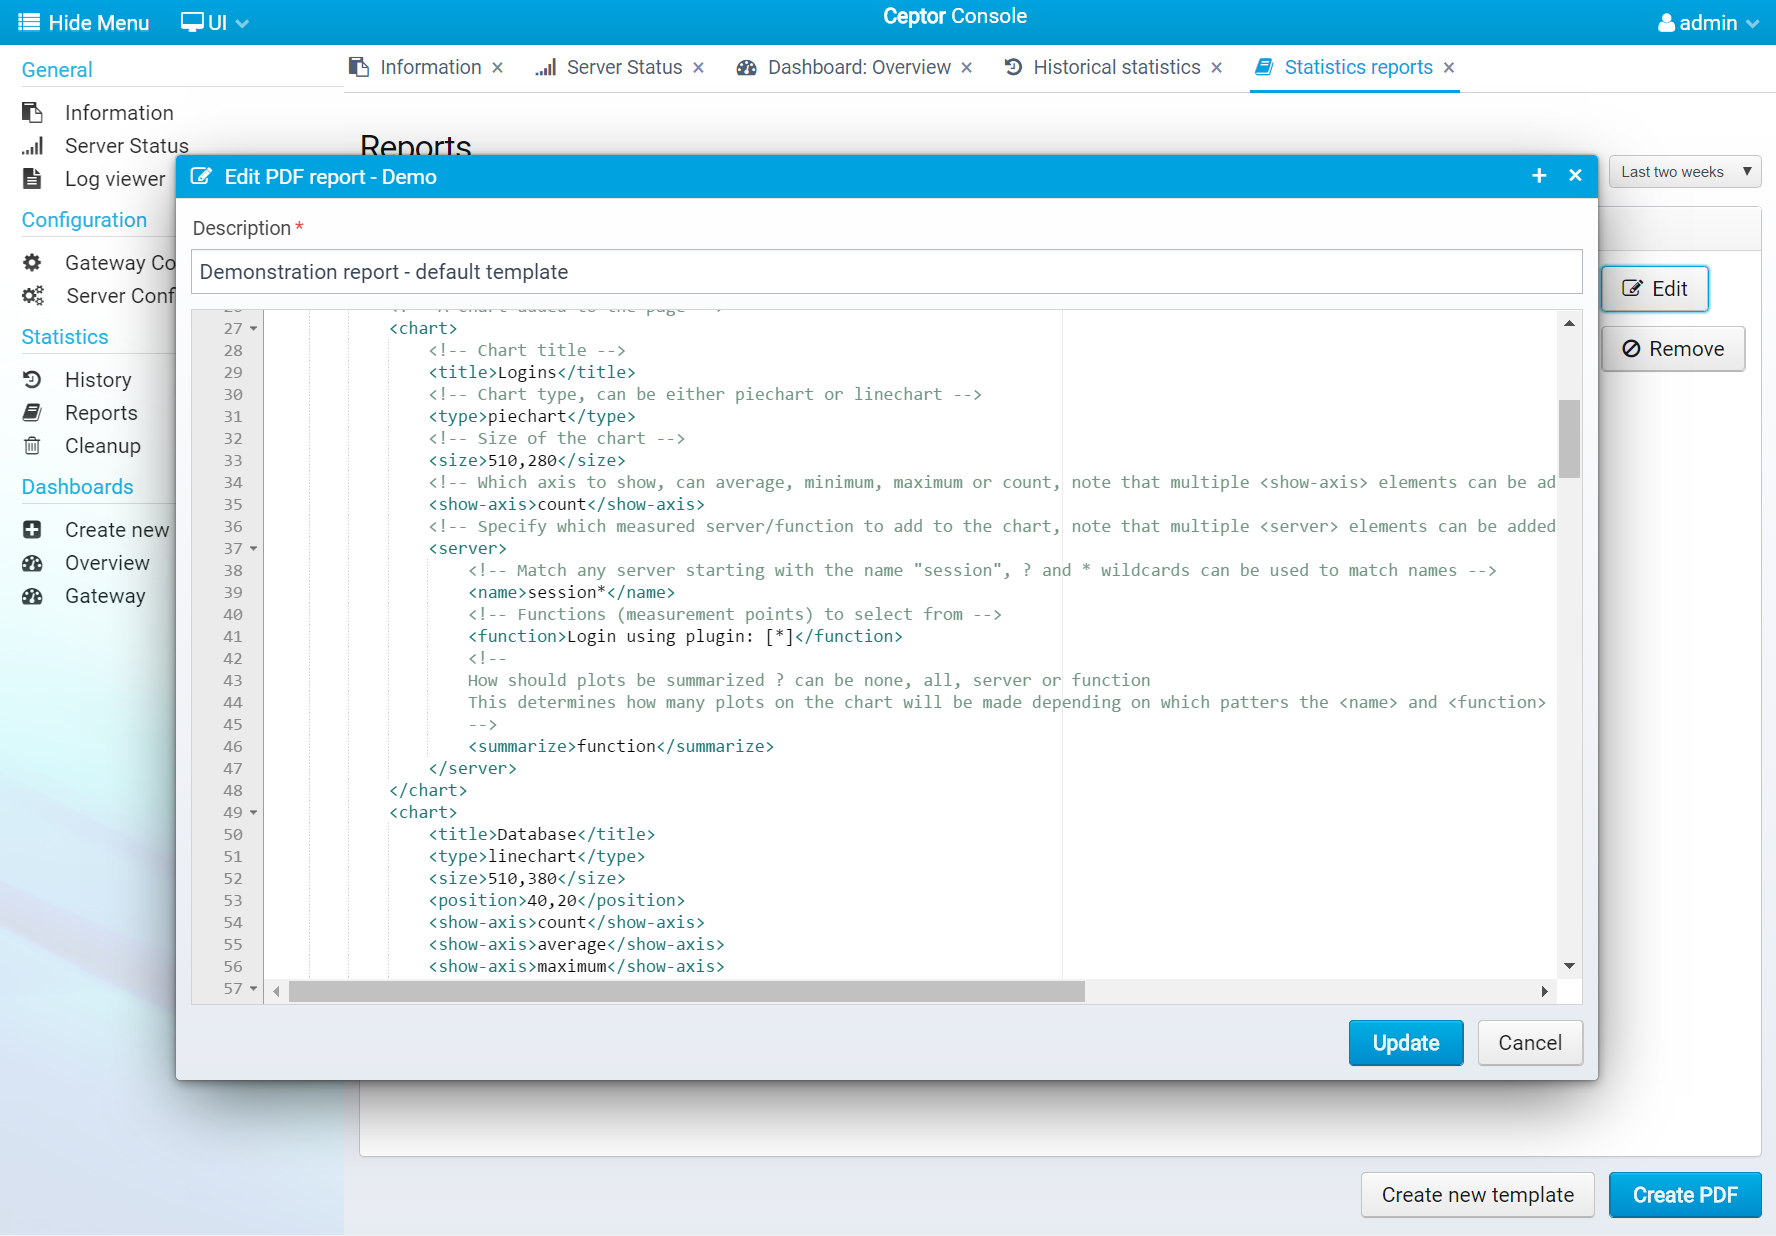
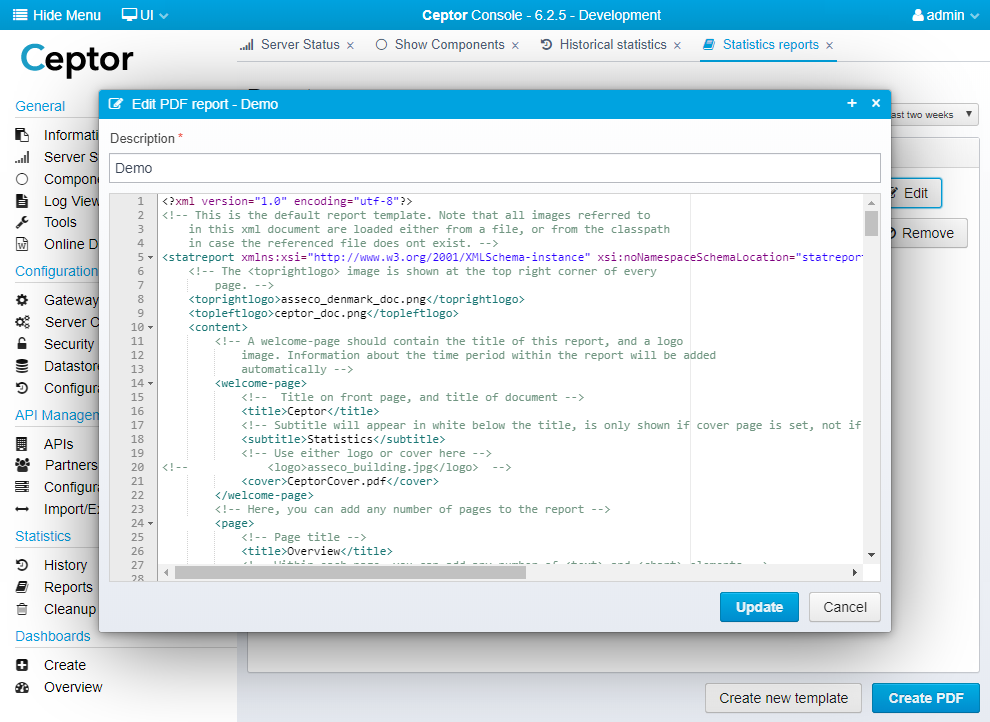
The template contains information about what pages to include in the report, and what data to extract from the statistics and display in it. You can add text, charts, markdown and images and in general customize the report with the content you need. Once you have a template, you can use it to generate reports for various audiences, such as technical personal with information about response times, or you can target business with reports containing information about the number of users, various login methods, uses of different applications etc.
...
Over the years, your statistics can become dirty and need a cleanup. if you select "Cleanup" from the Statistics menu, you get this screen:
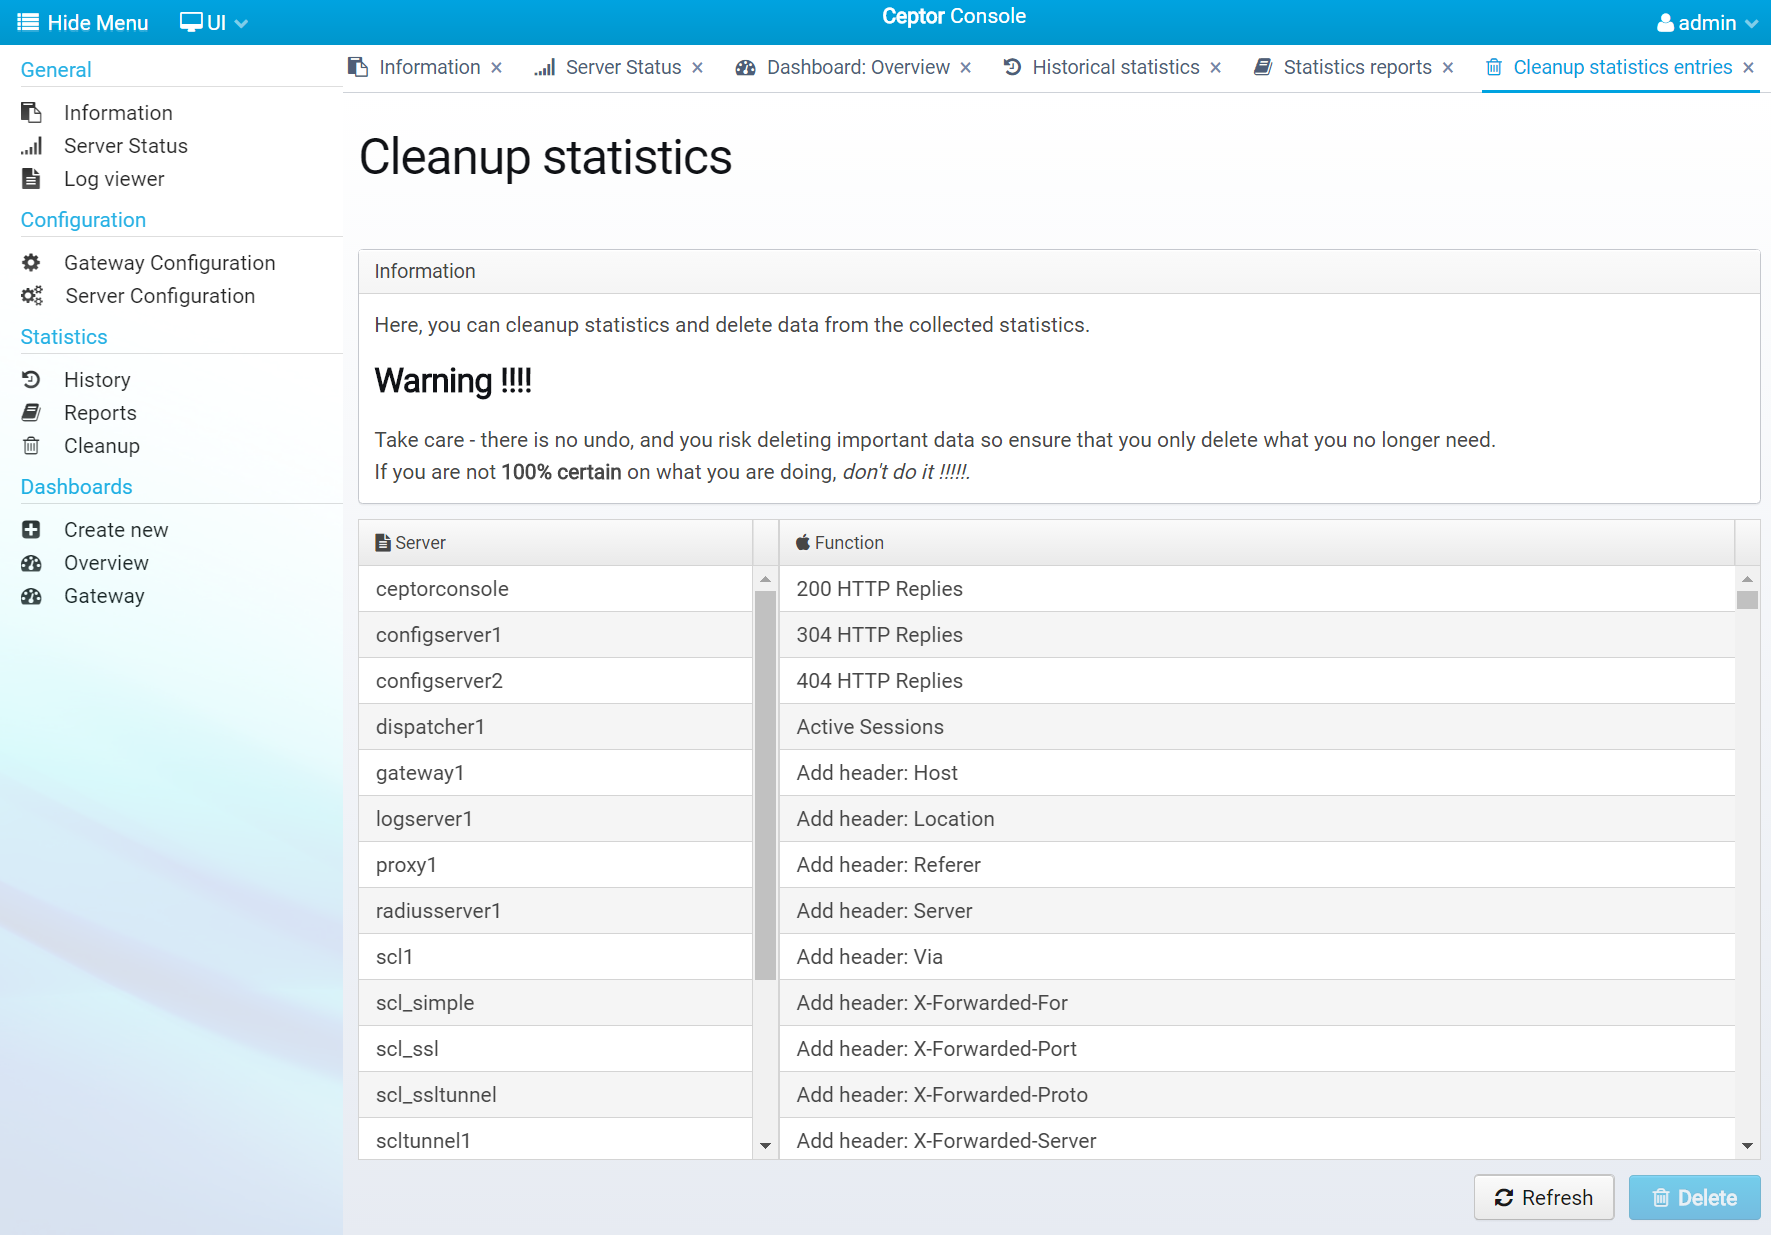
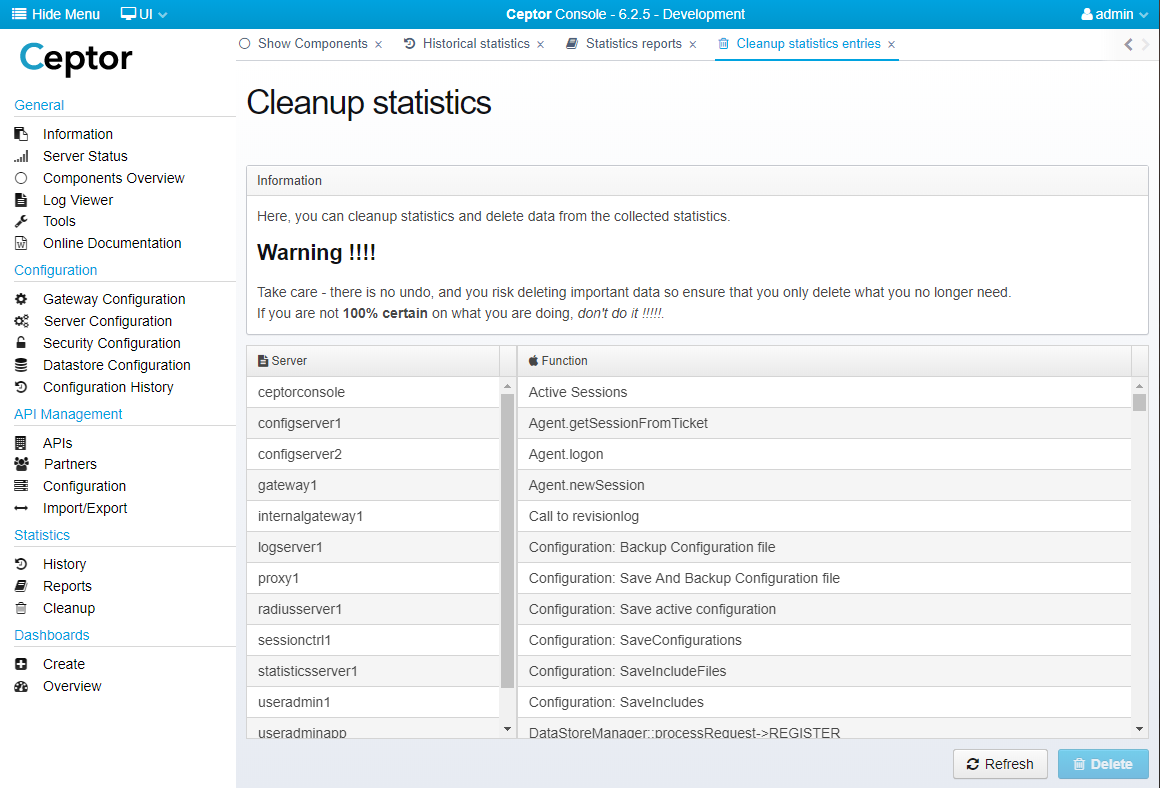
Here, you can remove obsolete statistics entries, e.g. for servers that no longer exists, or functions that are obsolete.
...