Versions Compared

Key

  • This line was added.
  • This line was removed.
  • Formatting was changed.

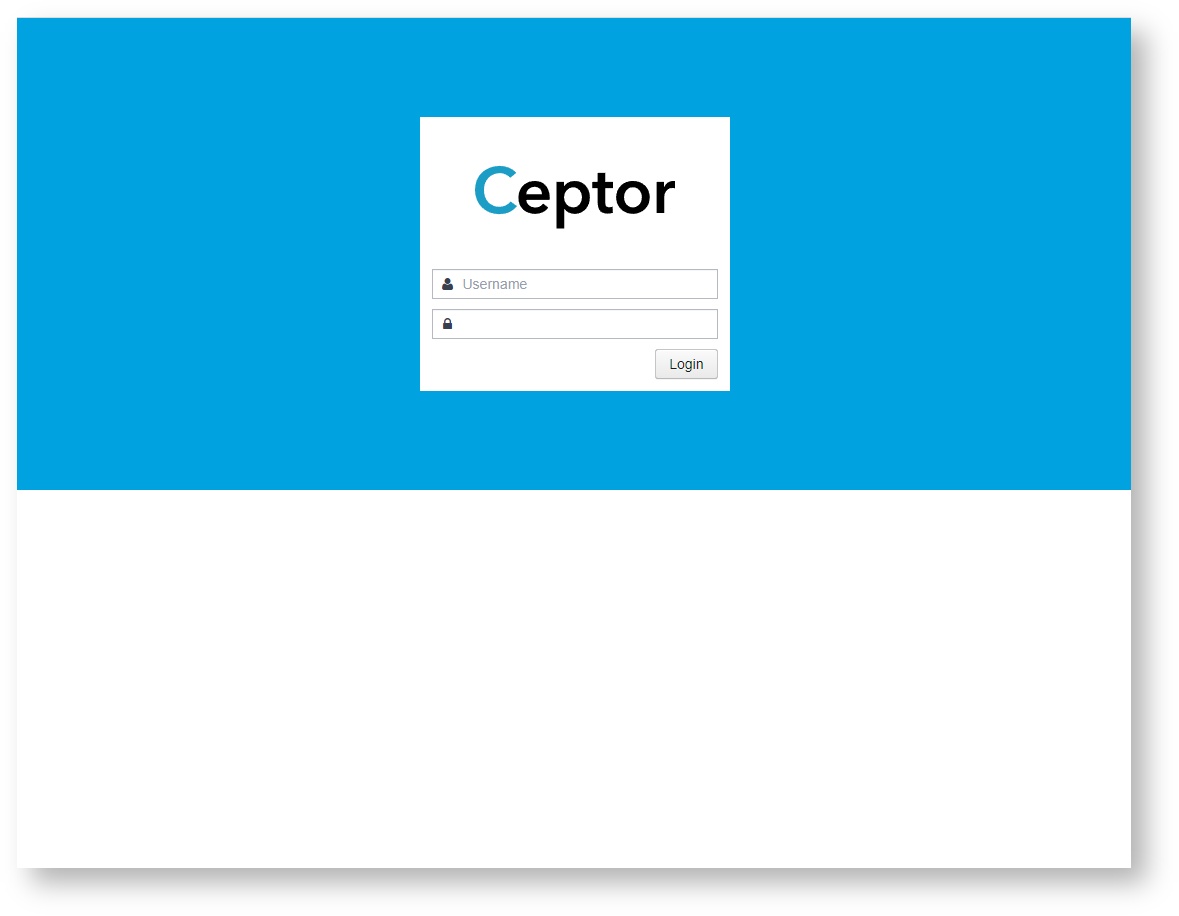
Ceptor Console is the administration console from where you access Ceptor.

Here, you can authenticate using one of the administration users and you can do any number of tasks ranging from viewing live server status to changing configuration or generating / viewing reports.

In the default configuration, you can access the console from your browser by going to https://localhost:4243 or http://localhost:4242 (replace localhost with the name of the server where you installed Ceptor.
You can change the SSL server certificate used by modifying ceptor_launch.xml - the default certificate is a self-signed one that your browser will complain is not valid since it is not issued by a trusted root.

Image Modified

Info

The following standard users are defined:

  • admin
    This user has all rights and can see and change all values in Ceptor. This user must be replaced by another user in the production environment to secure against any unwanted access.
  • readonly
    This user only has read access.

Both users use as standard password: password.

See Access Control for information about changing this.


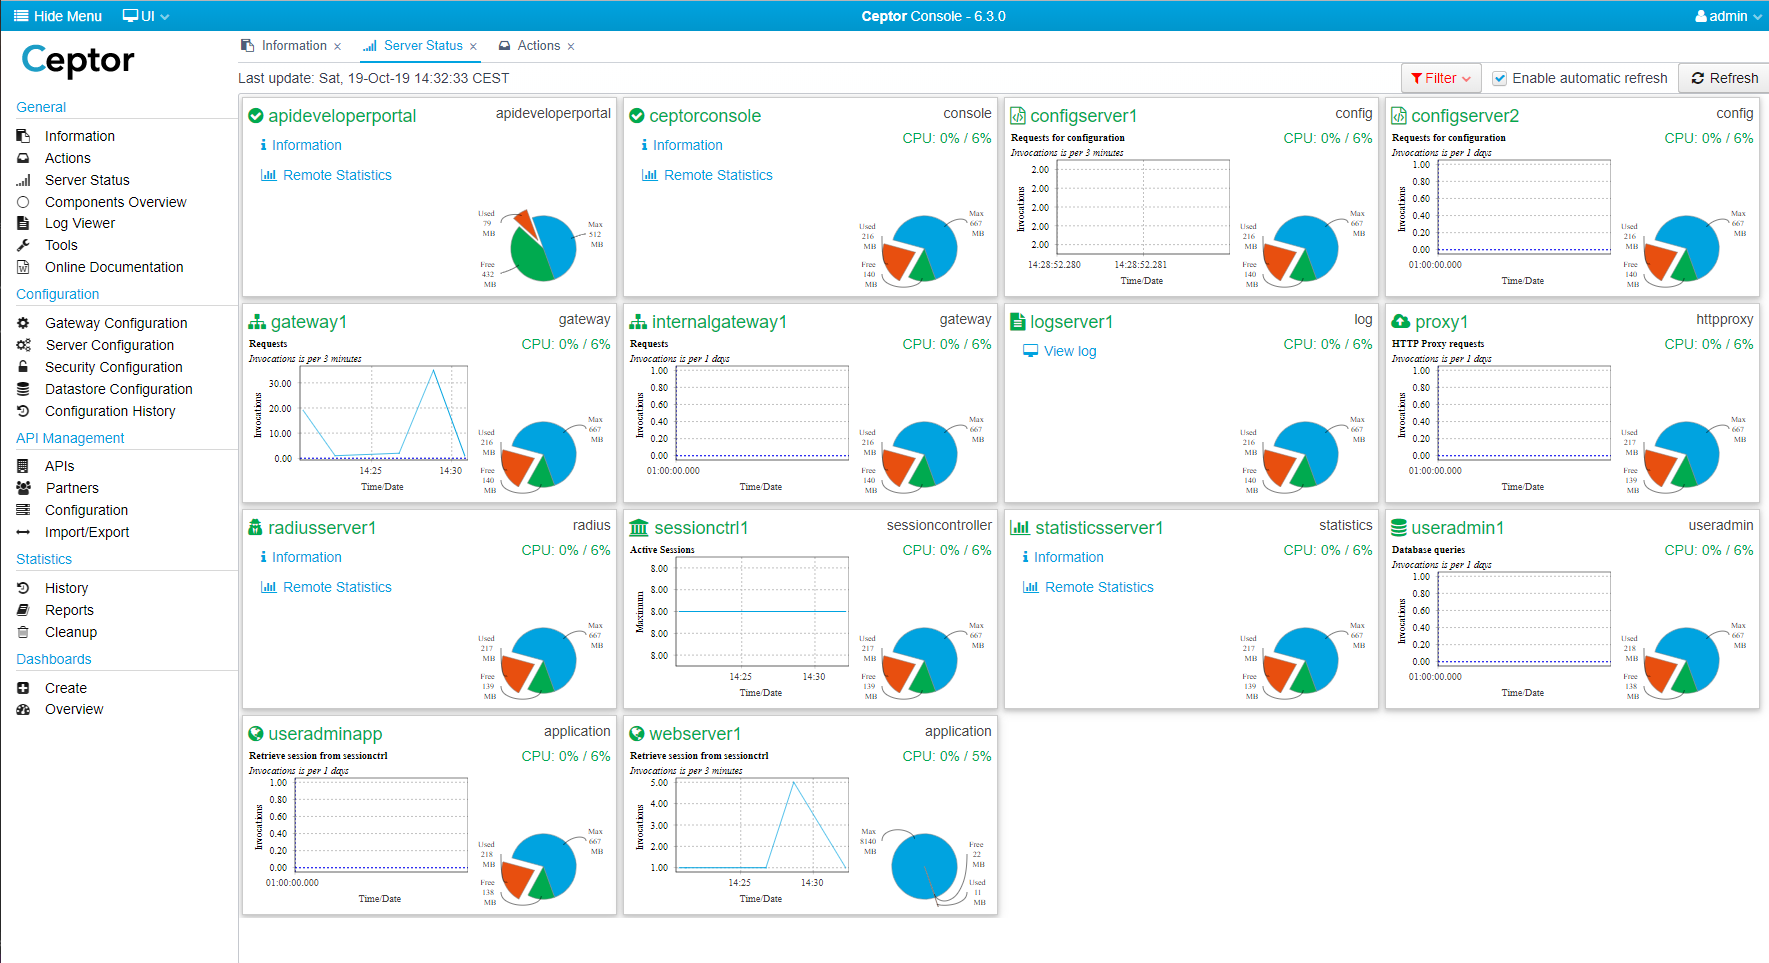
Once you have authenticated, you get to this screen:

Here, you can see the server/component status, the CPU and memory usage, and various statistics depending on the type of server.

Menu

Let us take a closer look at the menu:
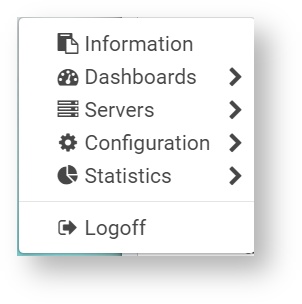
Here, you can click "Hide Menu" if you wish to hide the menu (you can always click "Show Menu" to get it back). You can also right-click the desktop anywhere to open a popup menu:

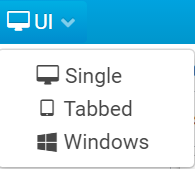
You can also change the UI type


Here, you can choose between

  • Single
    Show only one component at a time 
  • Tabbed
    Show multiple components, each in their own tab - you can change the active tab at the top. 
  • Windows
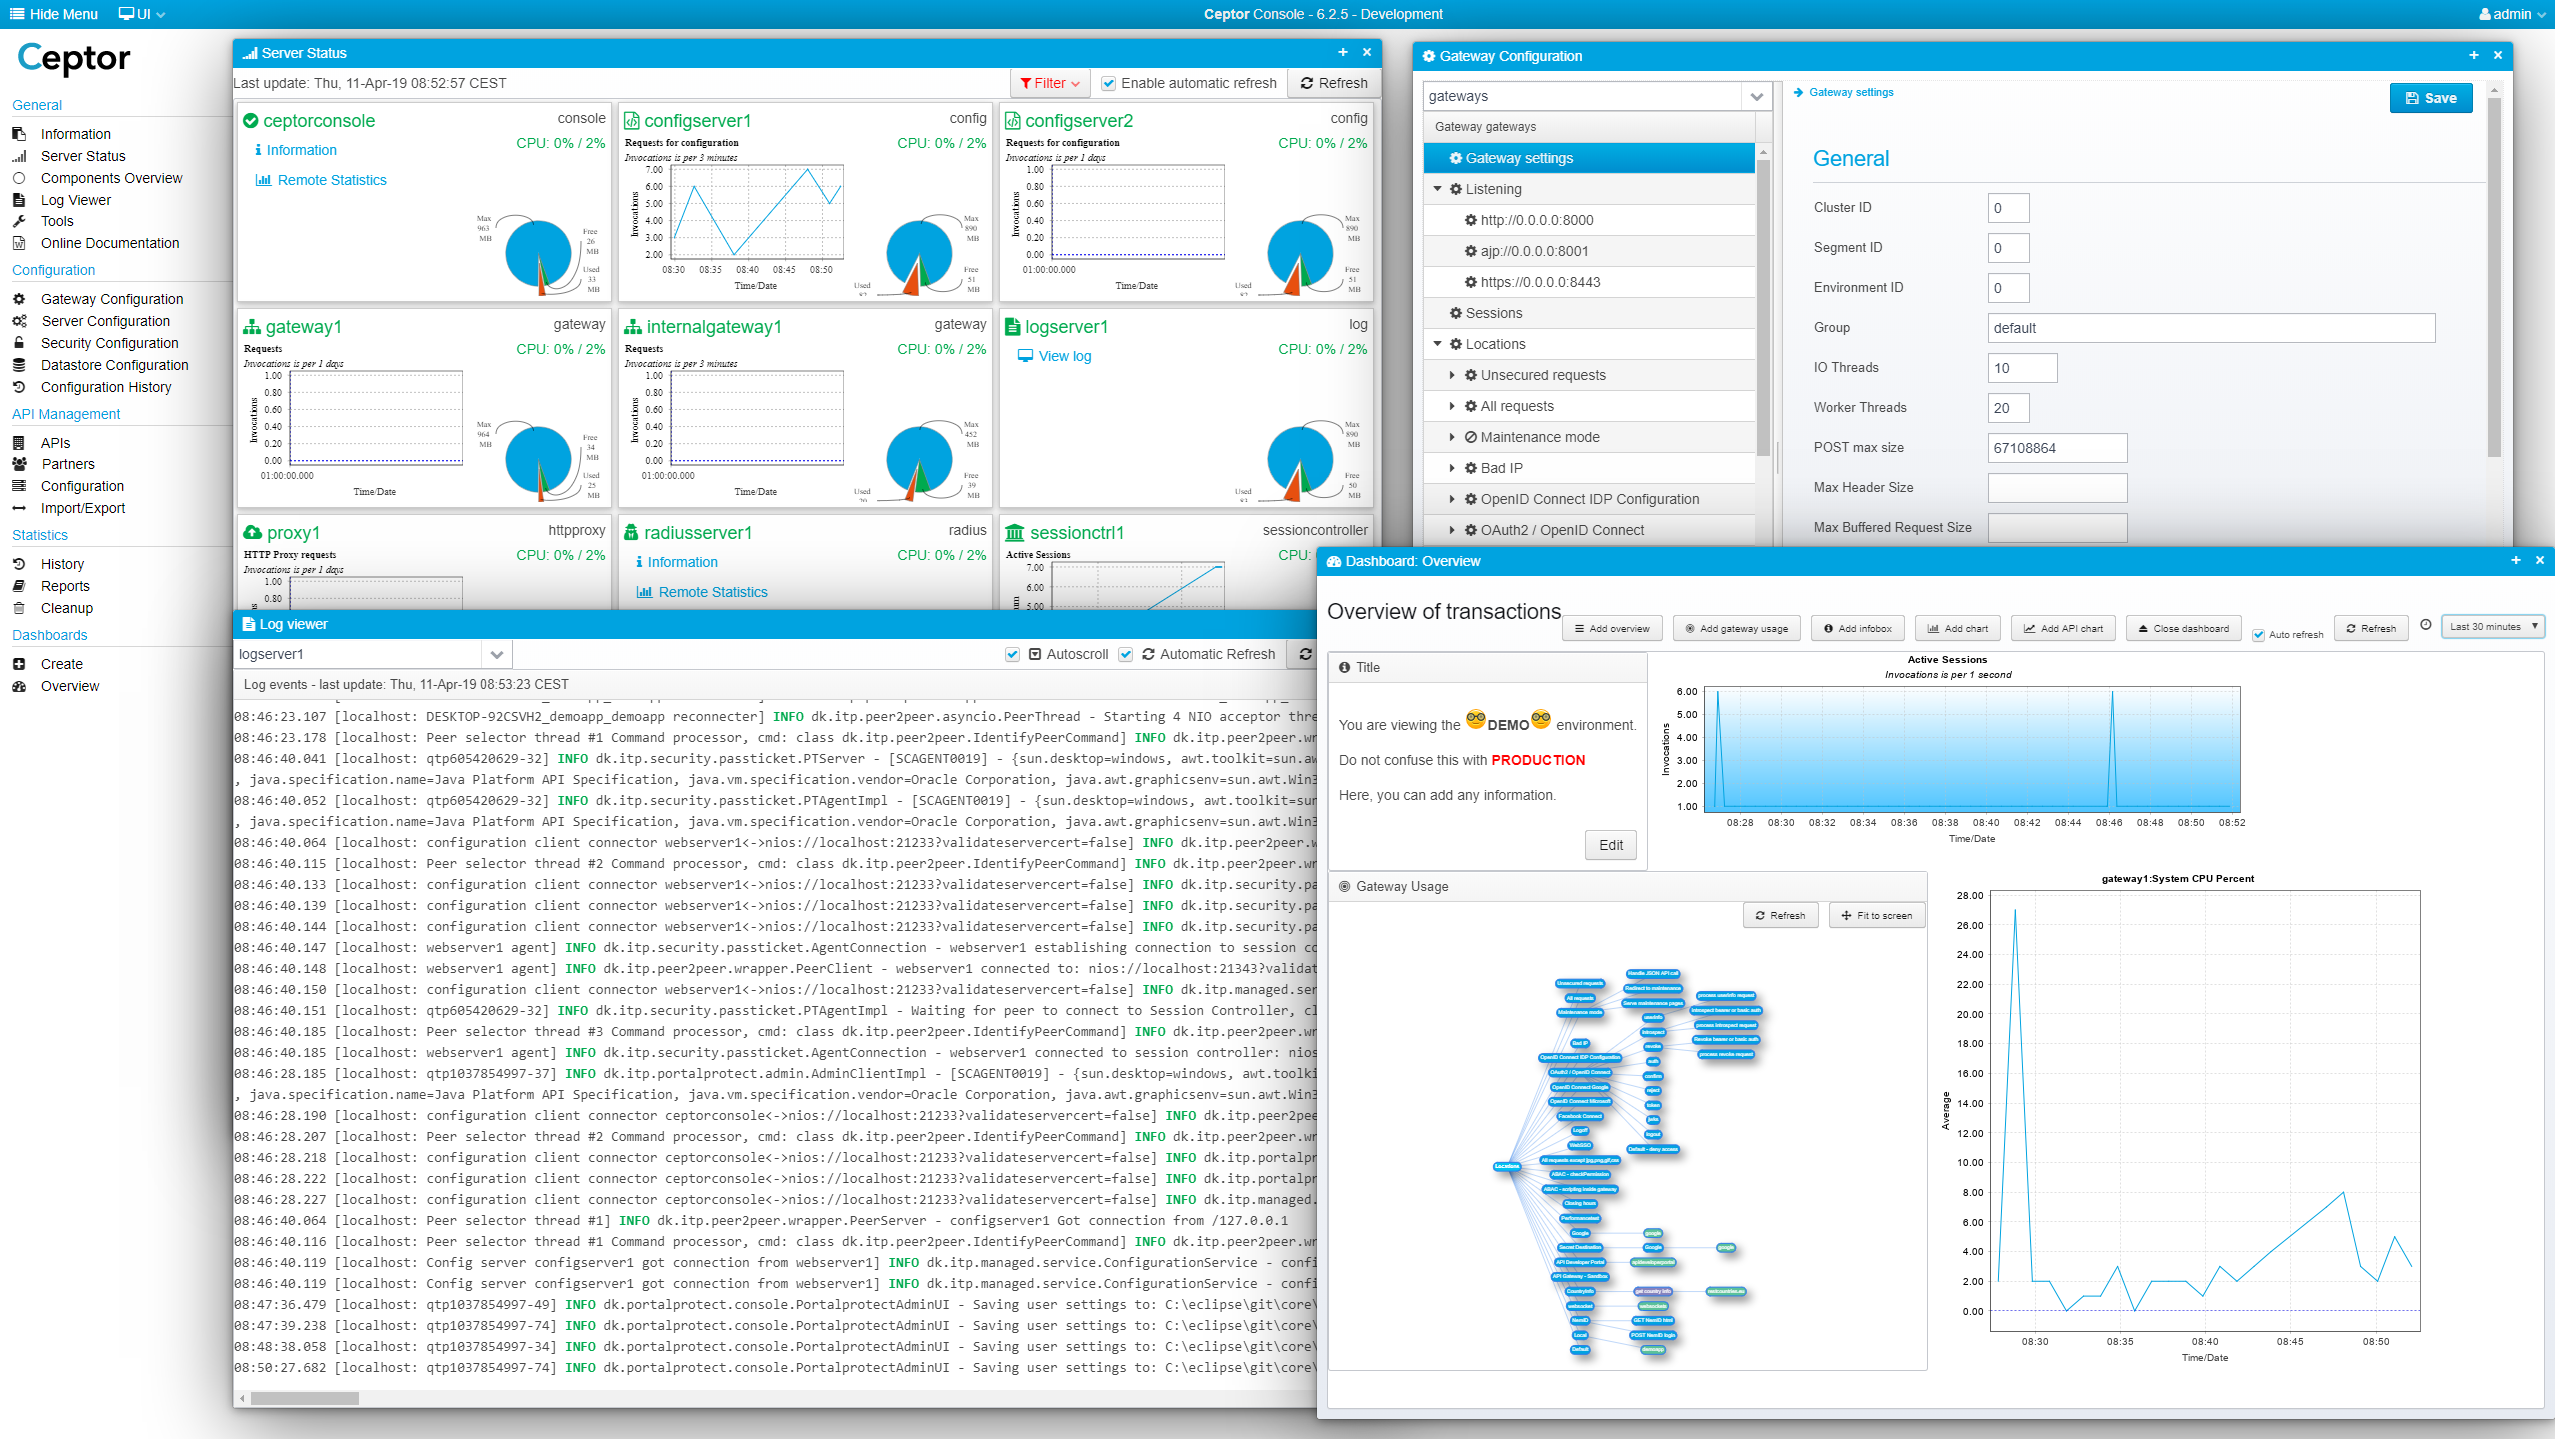
    Show multiple windows simultaneously, each with their own component inside.

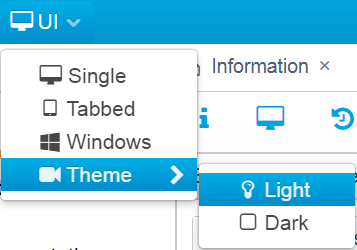
And you can change the Theme - choose between the default Light and a darker theme:

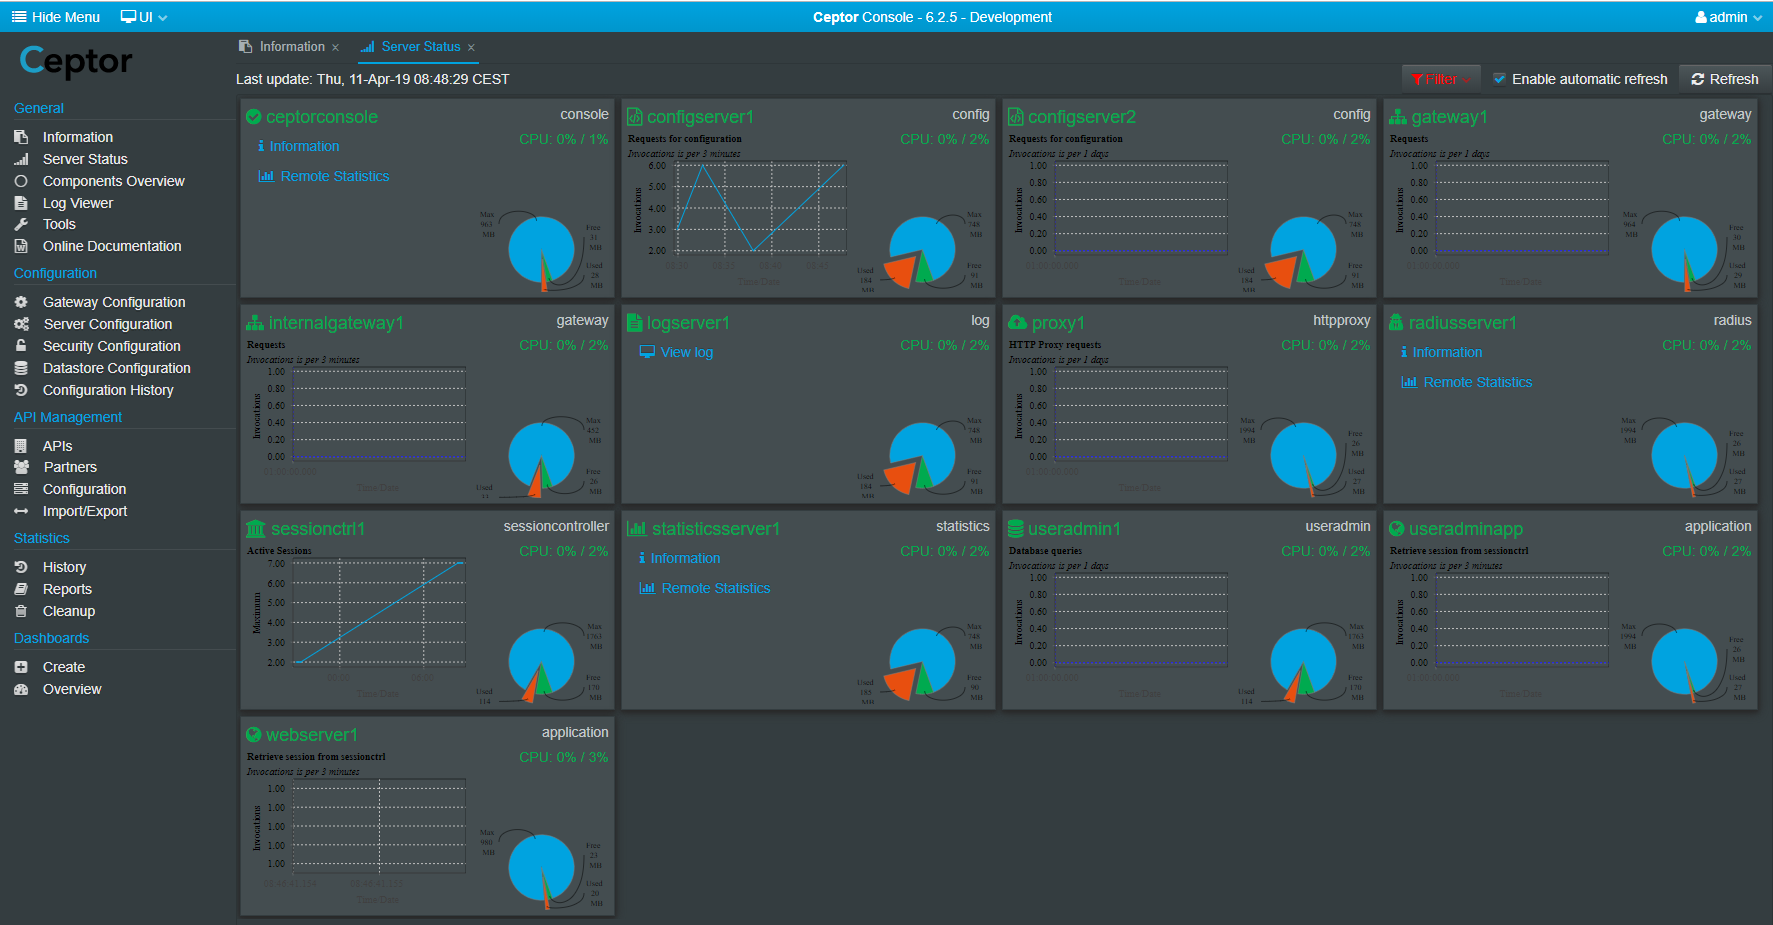
Here is an example of how the dark Theme looks if you prefer it:

We recommend running the browser in full-screen mode by pressing F11 - depending on the screen size and your preferences, you should choose tabbed or windows mode. For large screens, it is not uncommon to run windows mode, with several different opened windows simultaneously.

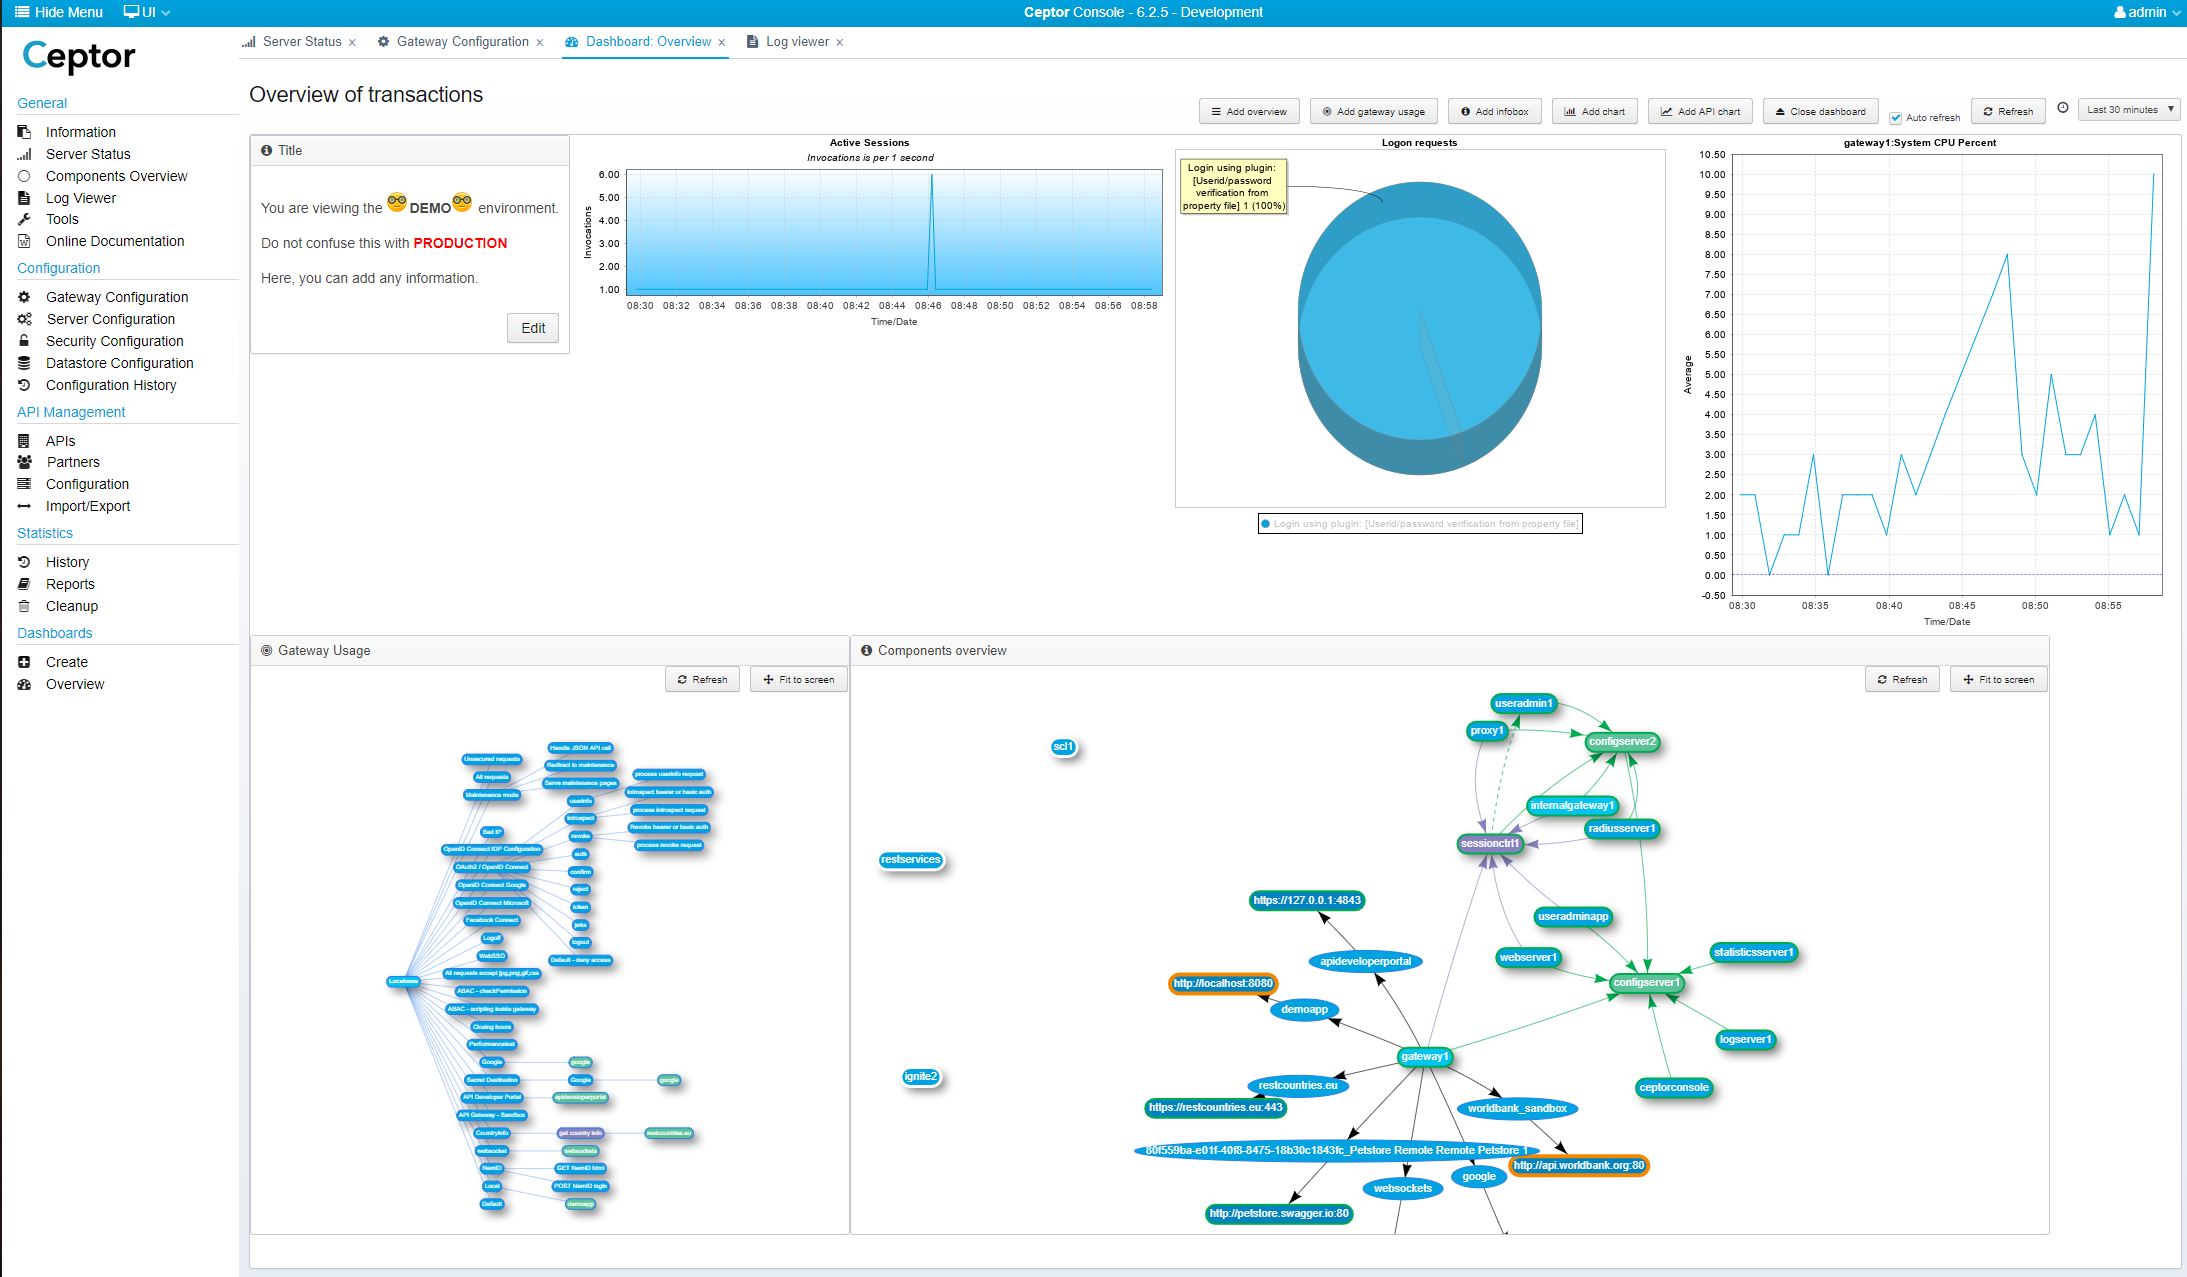
Here is an example of a dashboard showing the gateway usage diagram, as well as the component overview displaying which components are running, their status and their connections to one another.


Multimedia
nameDashboards_and_Tracing.mp4
width100%
pageCeptor Minimal Demo
autostarttrue