| Table of Contents | ||
|---|---|---|
|
From the Server Overview, you can select a server, and display its status, as well as display various details about the server instance itself.
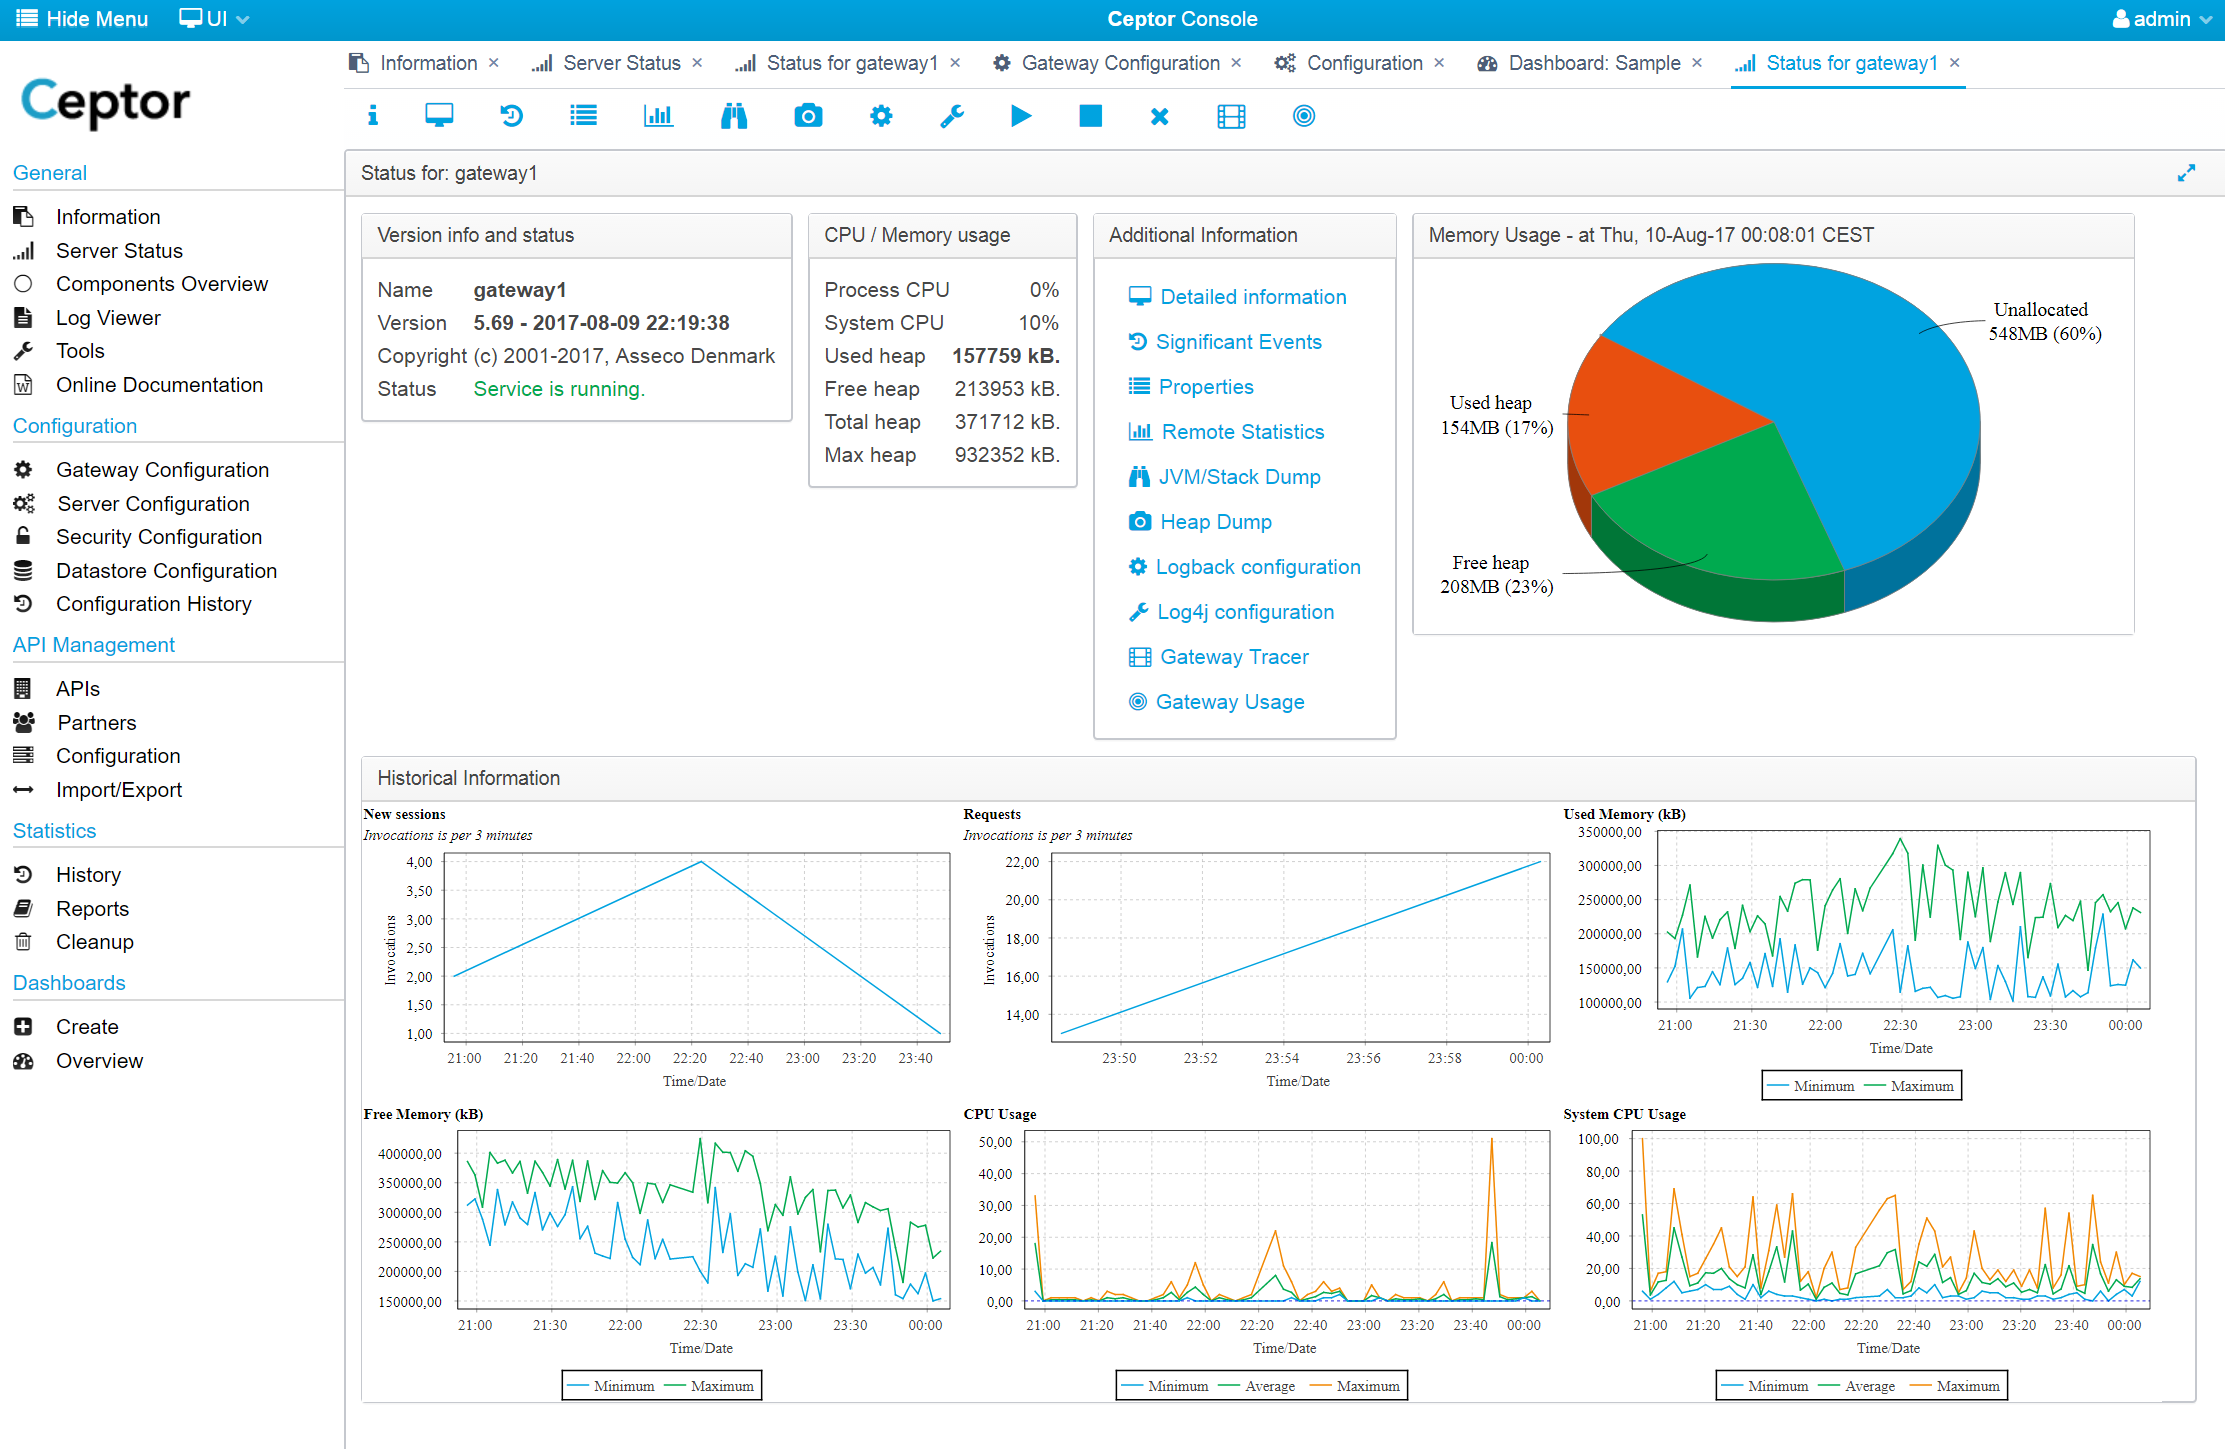
The status starts with displaying an overview page, showing relevant data for the server instance - including version number, current memory usage and relevant statistics depending on the server type.
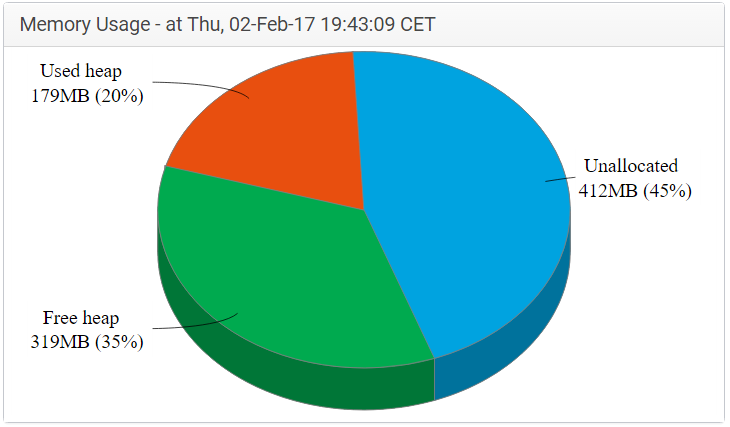
By looking at the pie chart, you can at a glance see how much memory is used, free and unallocated for this instance - this is a snapshot of the current status and will change when garbage collection occurs.
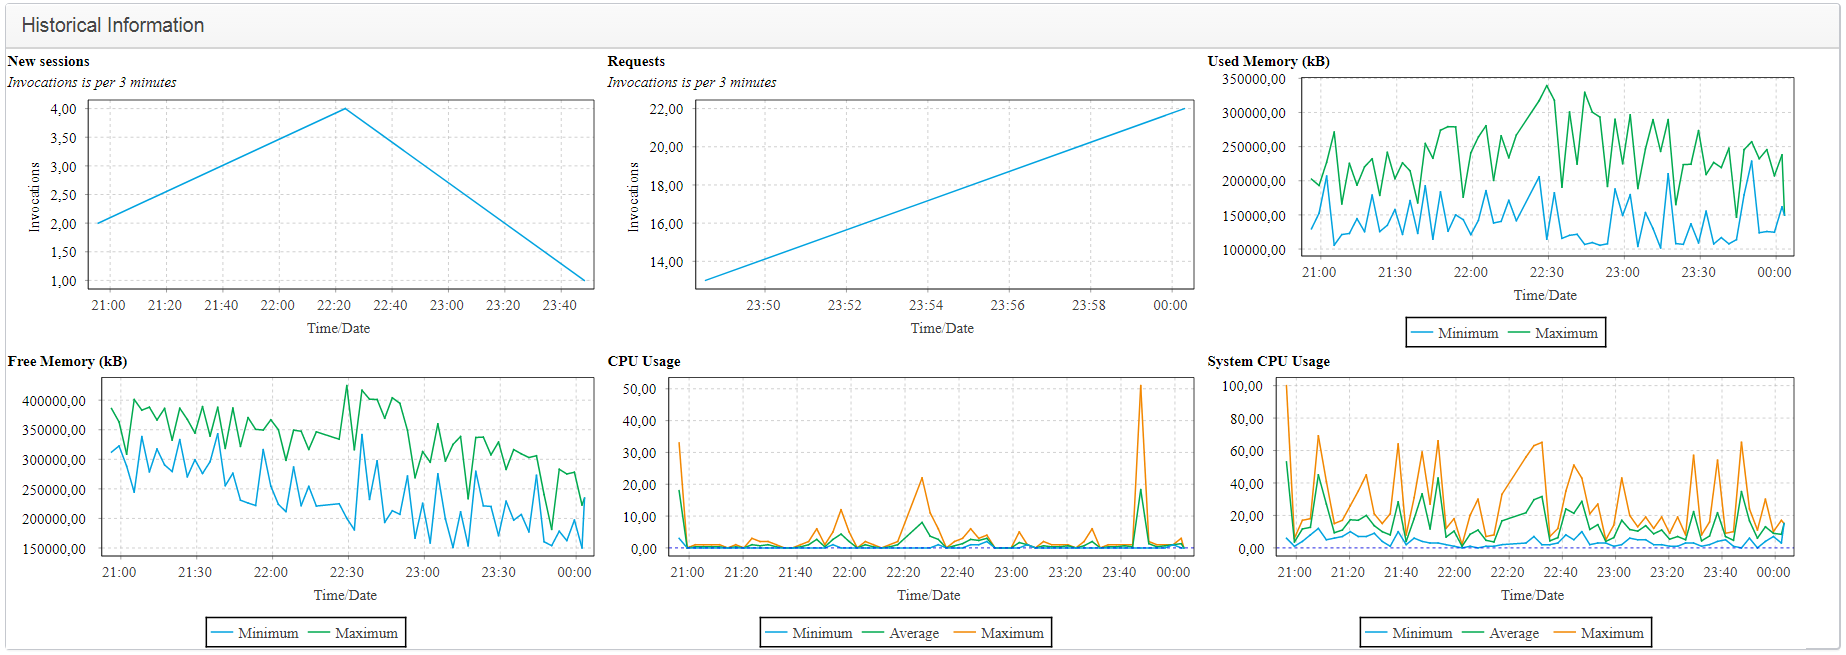
The Historical Information shows relevant statistics - for a gateway, that is the number of new sessions created, and the number of requests that have passed through it along with the history of memory usage and process and CPU usage.
The toolbar at the top contains a number of icons, from which you can select the page to view - the toolbar is present on all pages.

On the main status page, you also have this menu with shortcuts to the most relevant items:
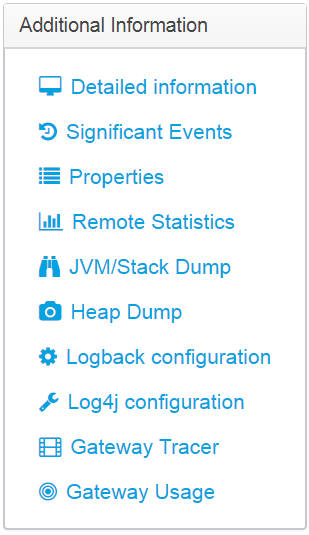
Detailed Information
Here, you can view detailed information for the server instance - the information depends highly on the server type - it ranges from log entries to detailed status information and diagnostics information.
Significant Events
Lists important events, such as stop/starts, disconnects and config updates timestamps.
Properties
Here you can view java system properties, as well as additional information the server instance might provide.
Remote Statistics
Allows you to see the statistics totals since startup - details are sent to the statistics server, so you need to look at Statistics for Dashboards for this.
JVM / Stack Dump
Allows you to perform a stack dump to see which threads are currently active, and what they are doing - this is is very useful for diagnostics.
Heap Dump
If you experience memory leaks, you can perform a Heap Dump here - note that this also works for applications containing a connect Ceptor Agent, allowing you to diagnose issues in your application servers.
Logback configuration
Here, you can change log levels at runtime, and enable debug/trace for specific parts of the code.
Log4j configuration
If you use log4j instead of logback, you can change logger settings here for this.
Gateway Tracer
This is unique to the Ceptor Gateway and will not be visible for other servers - it allows you to turn on full tracing of requests and will show you request and response contents as well as internal trace information from the gateway diagnosing the locations and steps the request went through. You can filter on any part of the request or enable it for specific users only.
See Gateway Tracing for more information.
Gateway Usage
This is unique to the Ceptor Gateway and will not be visible for other servers, it displays a diagram over all configured locations, pipelines and destinations and provides a good way of visualizing the configuration and see which locations call which destinations. It is periodically updated with information about the number of requests and average response time.
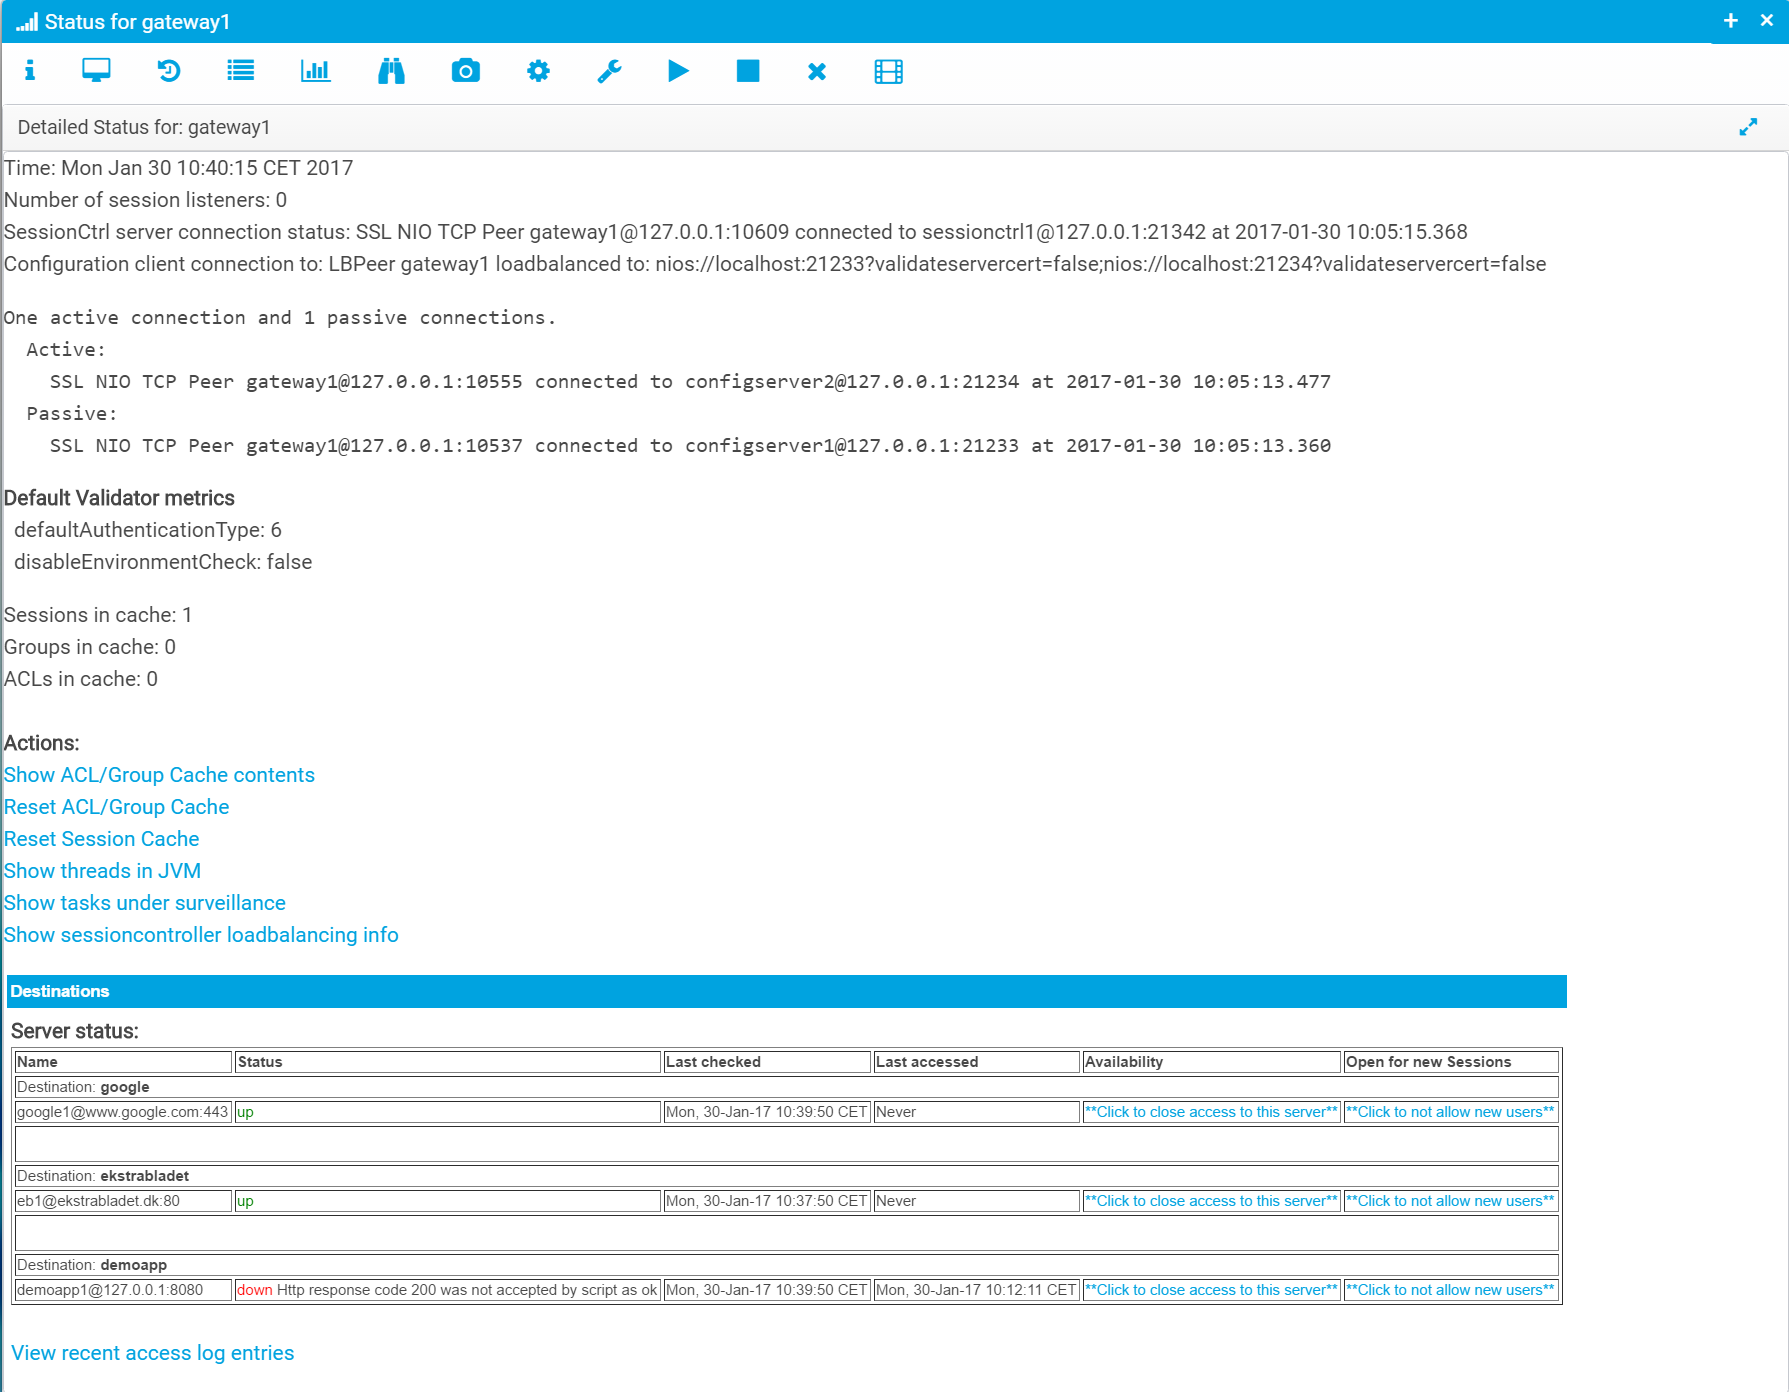
Detailed Information
Here, you can view detailed information for the specific server instance.
This example shows what is available in the gateway, which currently provides a list of configured destinations and target servers and their current status. It also allows you to view the latest entries in the access log.
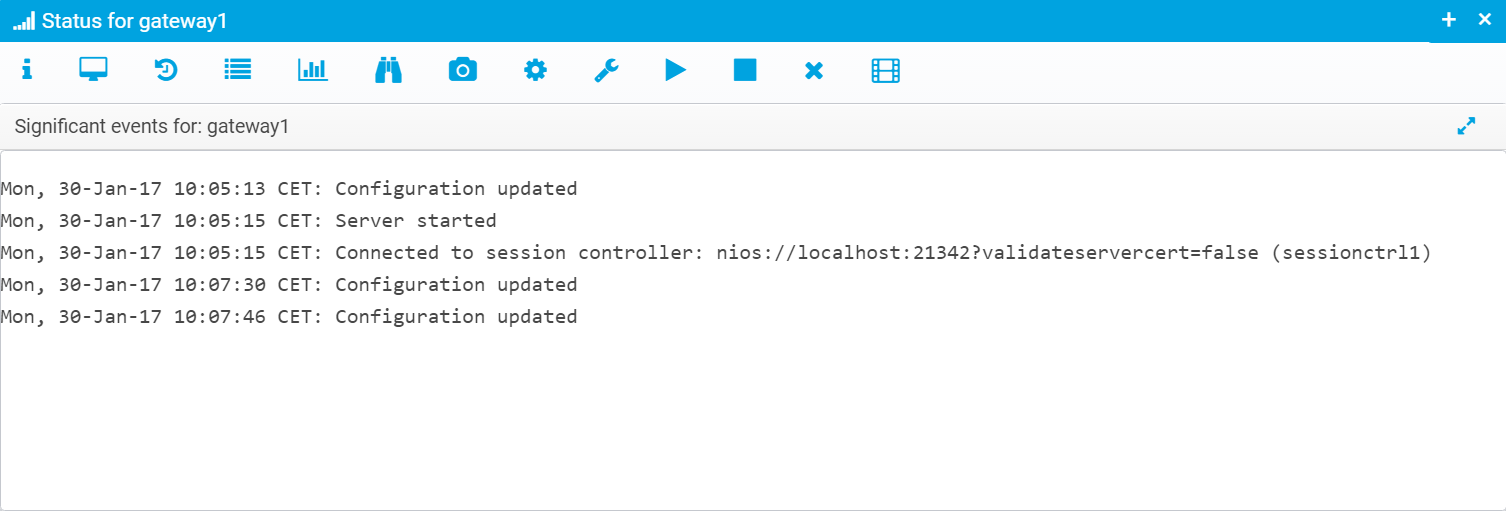
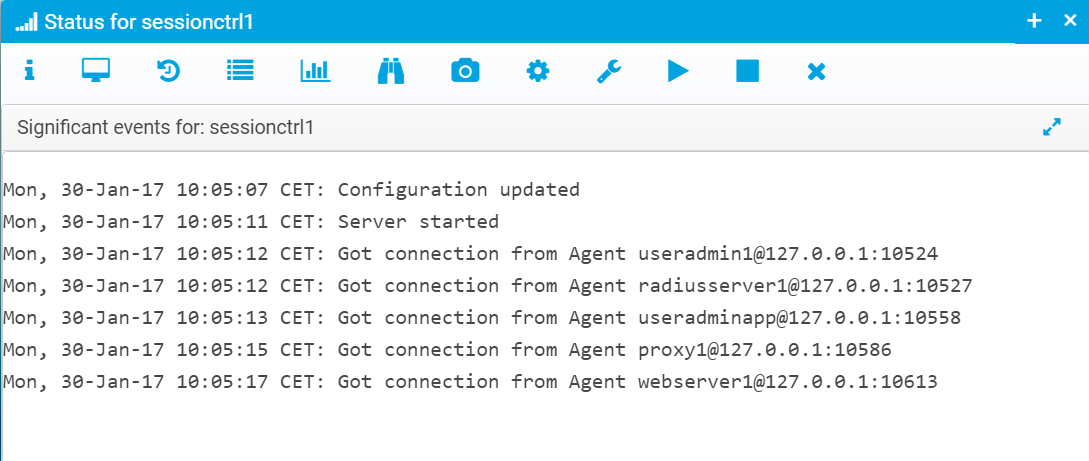
Significant Events
Shows events that might otherwise be easy to miss in the logfiles - things such as starting and stopping or disconnects/reconnects between servers as well as config updates are listed here - the same information can be found in the log files, so only a very small subset is available here:
Example from the gateway:
... and another example from the session controller:
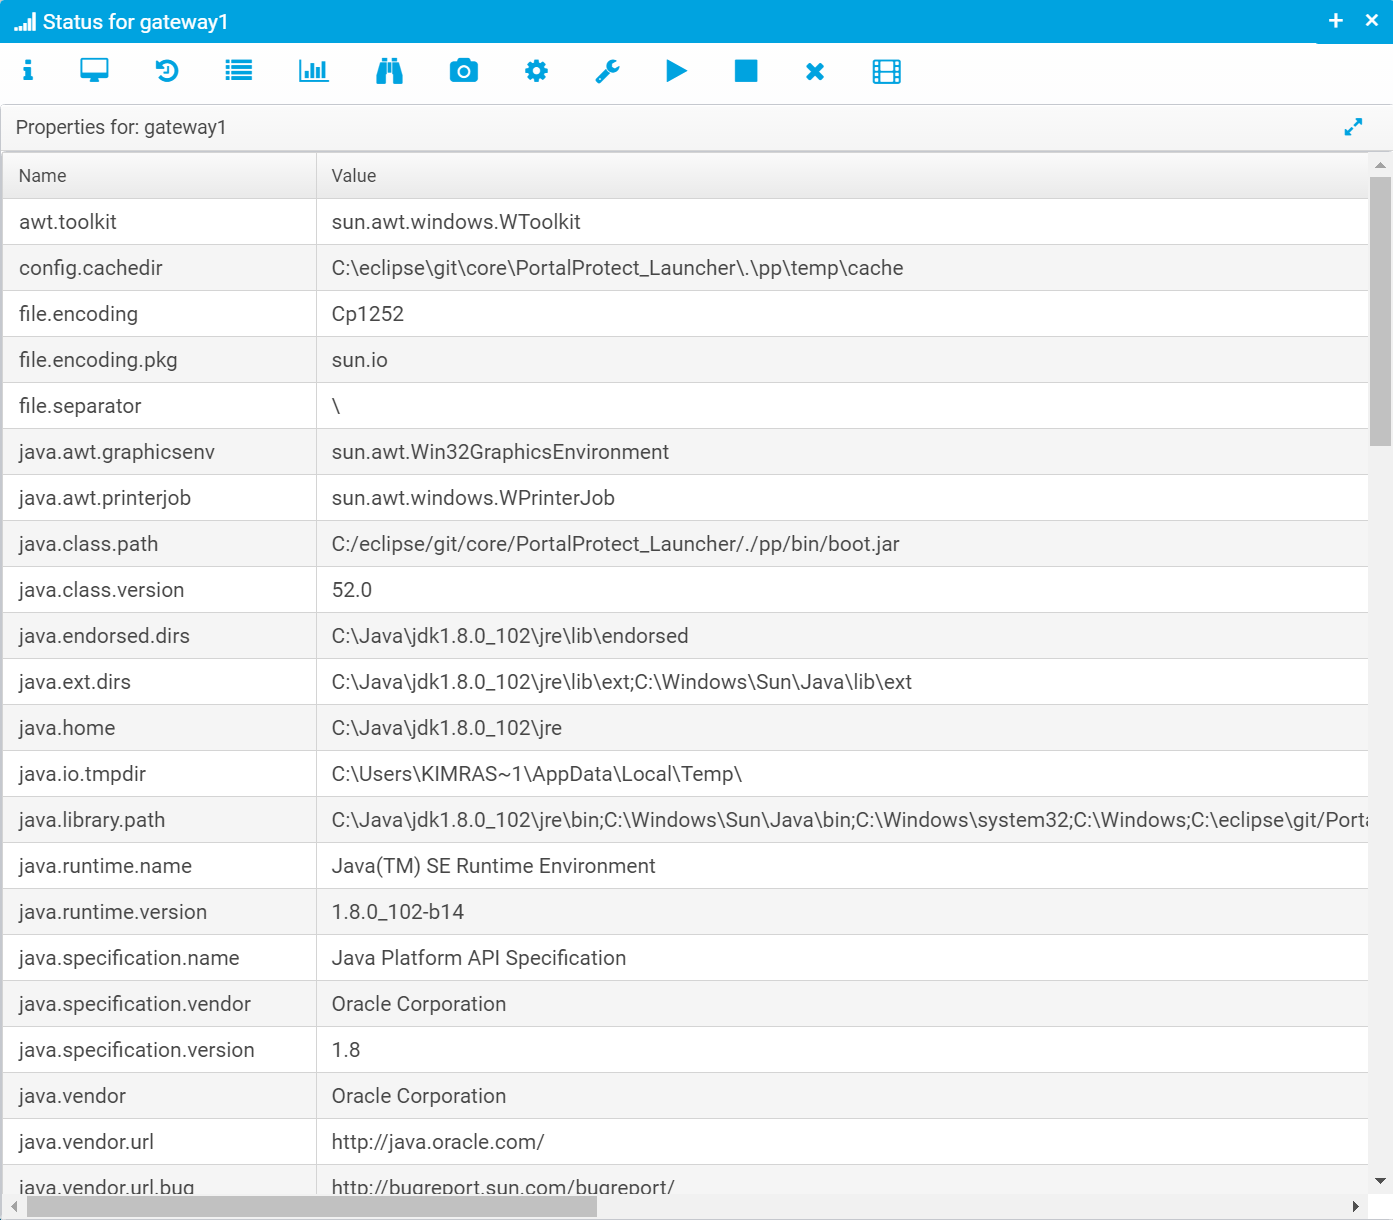
Properties
Her you can view java system properties, as well as additional information the server instance might provide.
This is an example for the gateway:
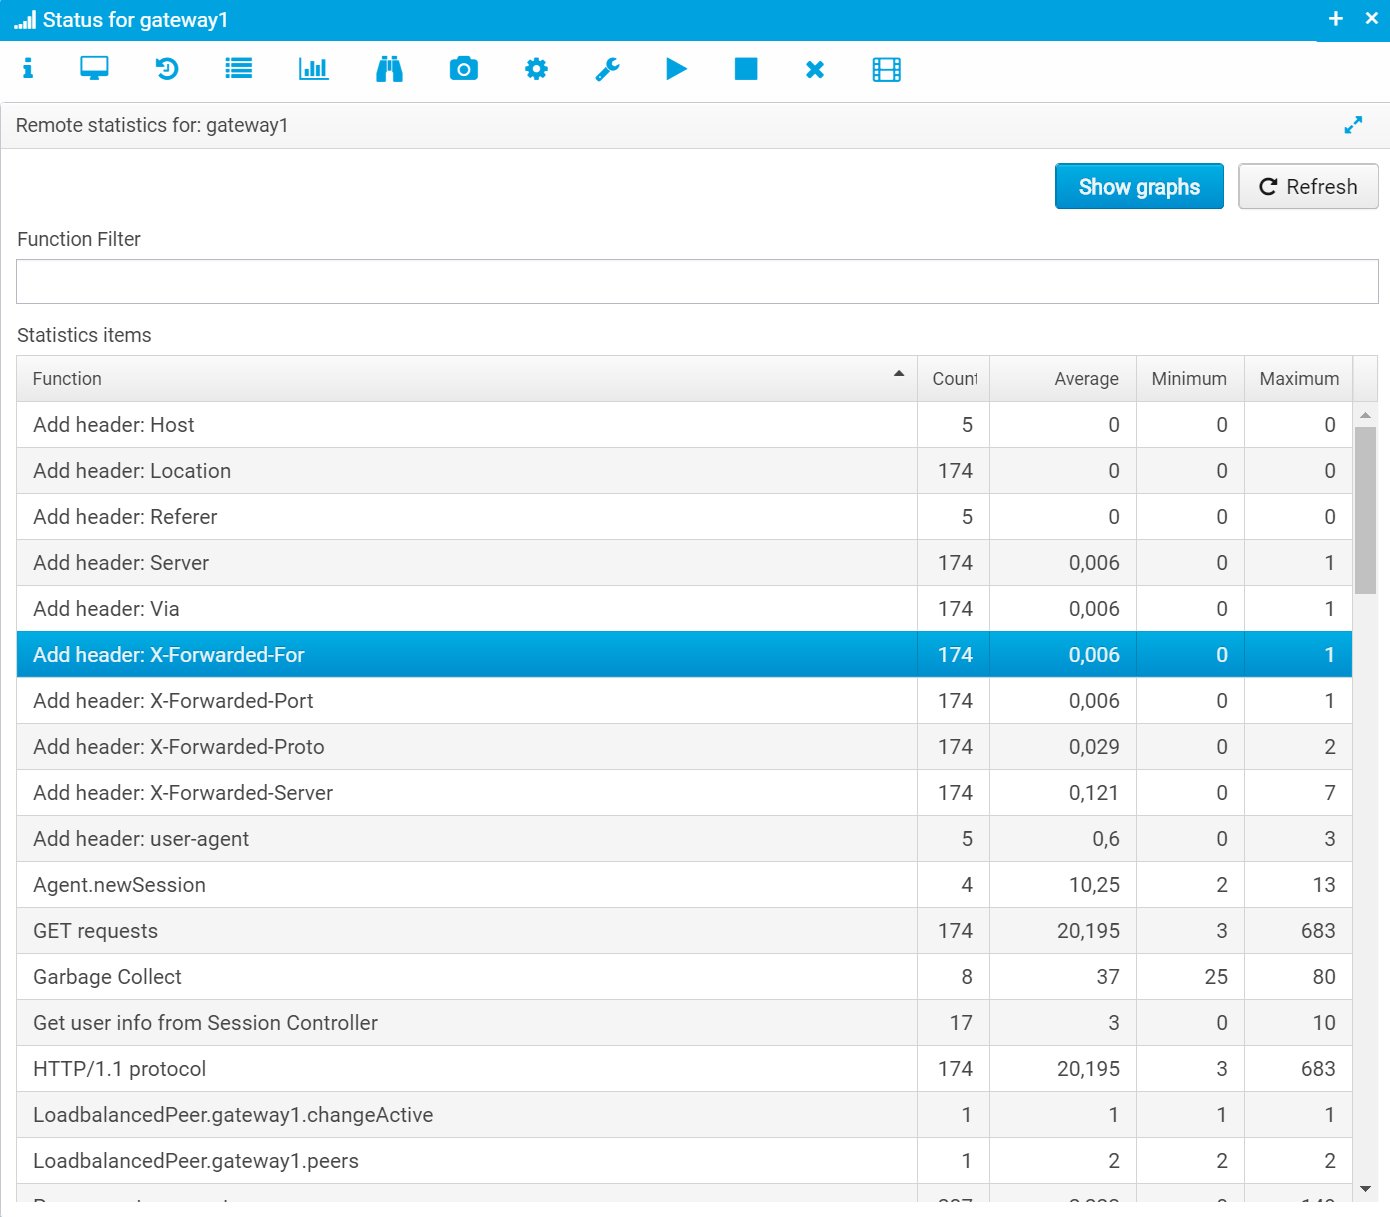
Remote Statistics
Allows you to see the statistics totals since startup - details are sent to the statistics server, so you need to look at Statistics for Dashboards for this.
This is an example from the gateway which e.g. keeps statistics on the amount of time it took to add an HTTP header to the request or response (this might sound too detailed, but if the content of the header is generated by javascript code that for some reason is slow, you can see it here).
You can filter contents by entering data in the filter which will show you only matching data.
If you click "Show graphs" you get this screen:
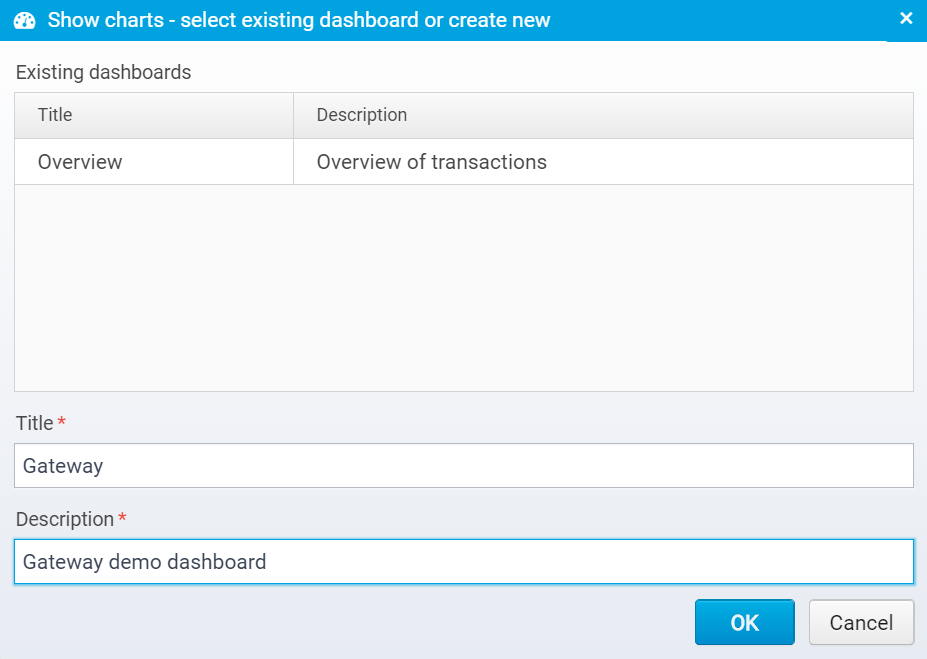
where you can choose a dashboard to add graphs to, or create a new one.
Adding graphs to the dashboard will create 4 different ones by default; one for invocations, another for average response time, and one for minimum and finally one for maximum. You can right-click them and change them, edit properties, add more graphs/plots, change colors etc. - see Dashboards for details.
JVM / Stack Dump
Allows you to perform a stack dump to see which threads are currently active, and what they are doing - this is is very useful for diagnostics.
Example: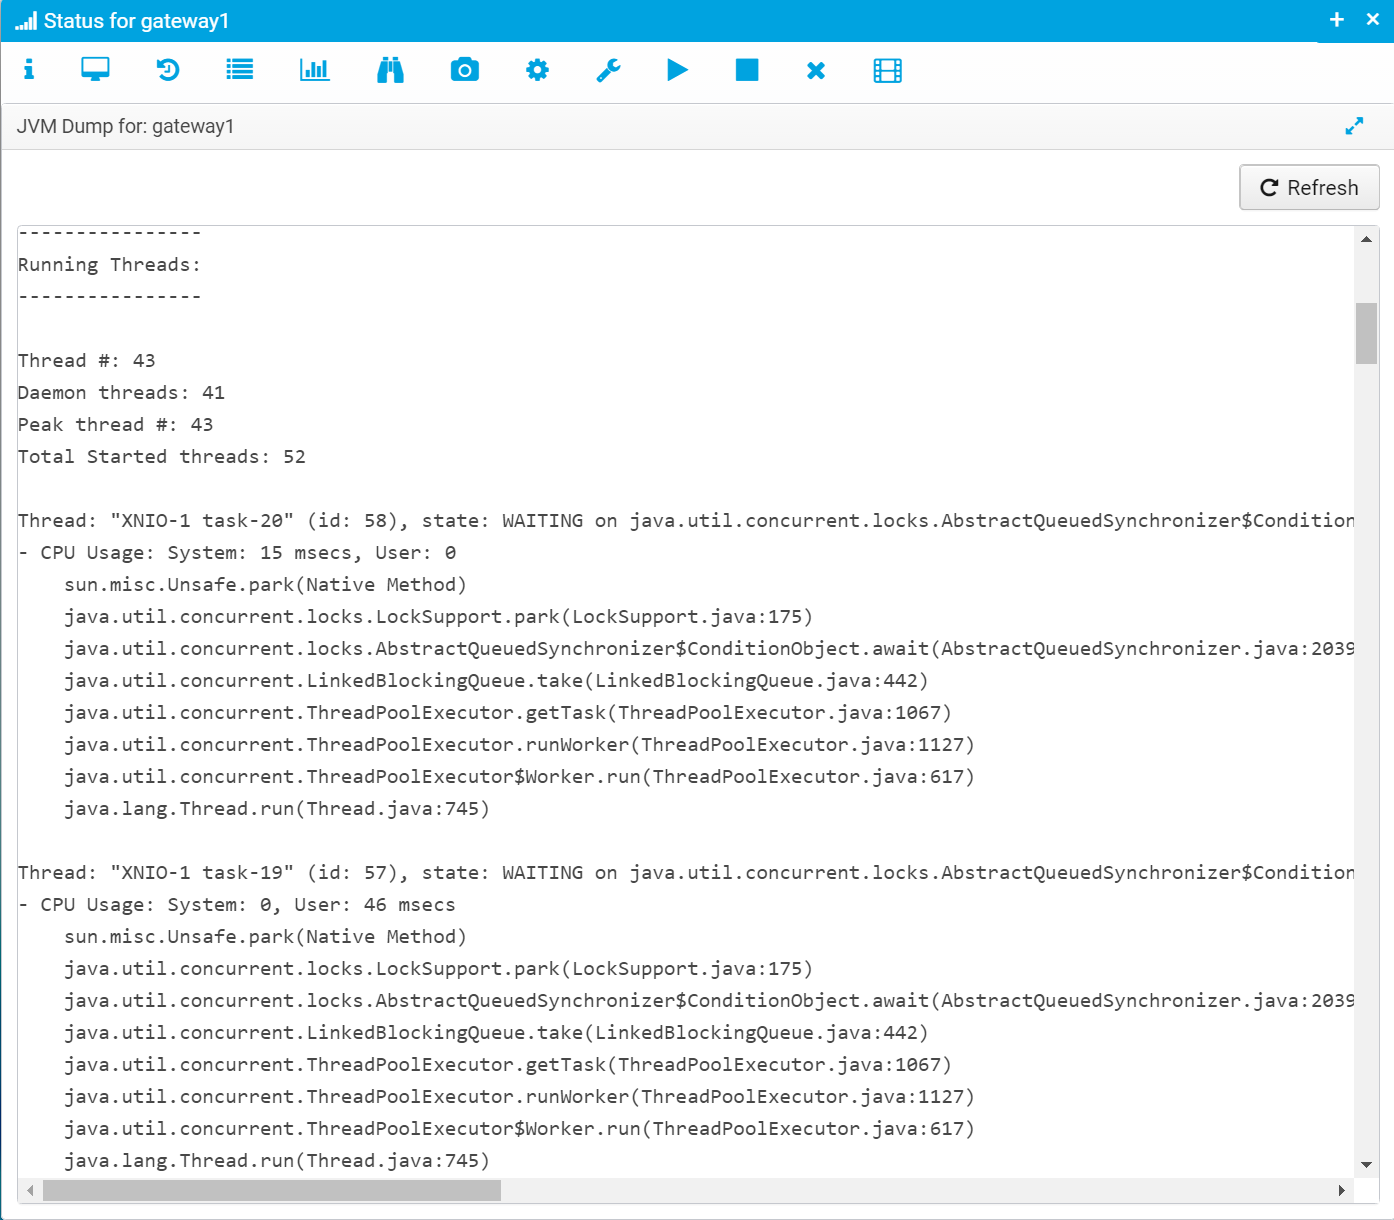
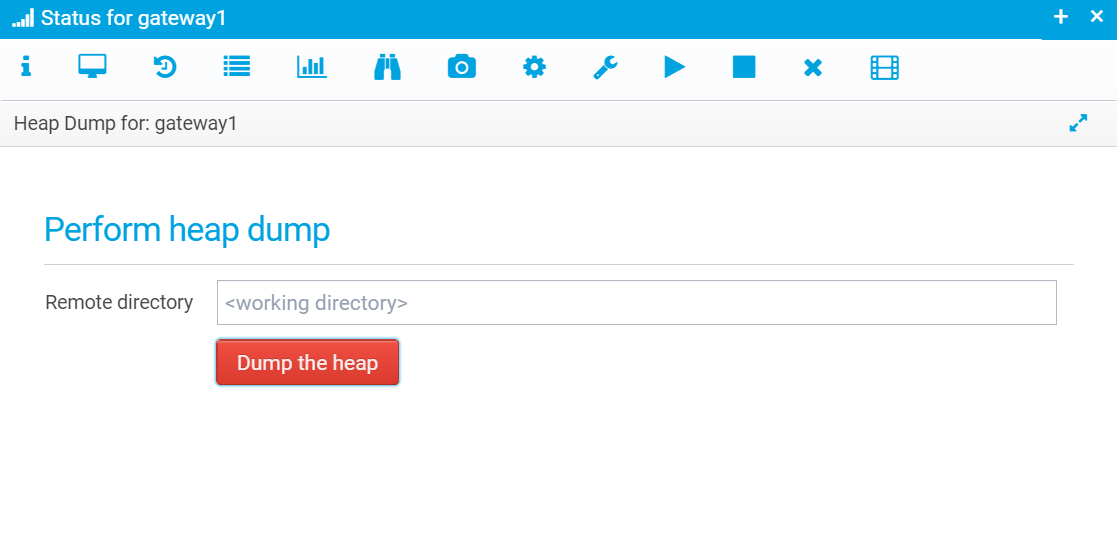
Heap Dump
If you experience memory leaks, you can perform a Heap Dump here - note that this also works for applications containing a connect Ceptor Agent, allowing you to diagnose issues in your application servers.
You can specify the directory to save the dump in, or chose the default working directory - once the dump is made, it will tell you where the dump file was written to, and what it was named. Its name will be similar to: heapdump_<current_date_and_time>.bin. To analyze the file, you can use any available Java Profiler, such as JProfiler or you can use the free eclipse tool Memory Analyzer downloadable from here: http://www.eclipse.org/mat/
Logback Configuration
Here, you can change log levels at runtime, and enable debug/trace for specific parts of the code.
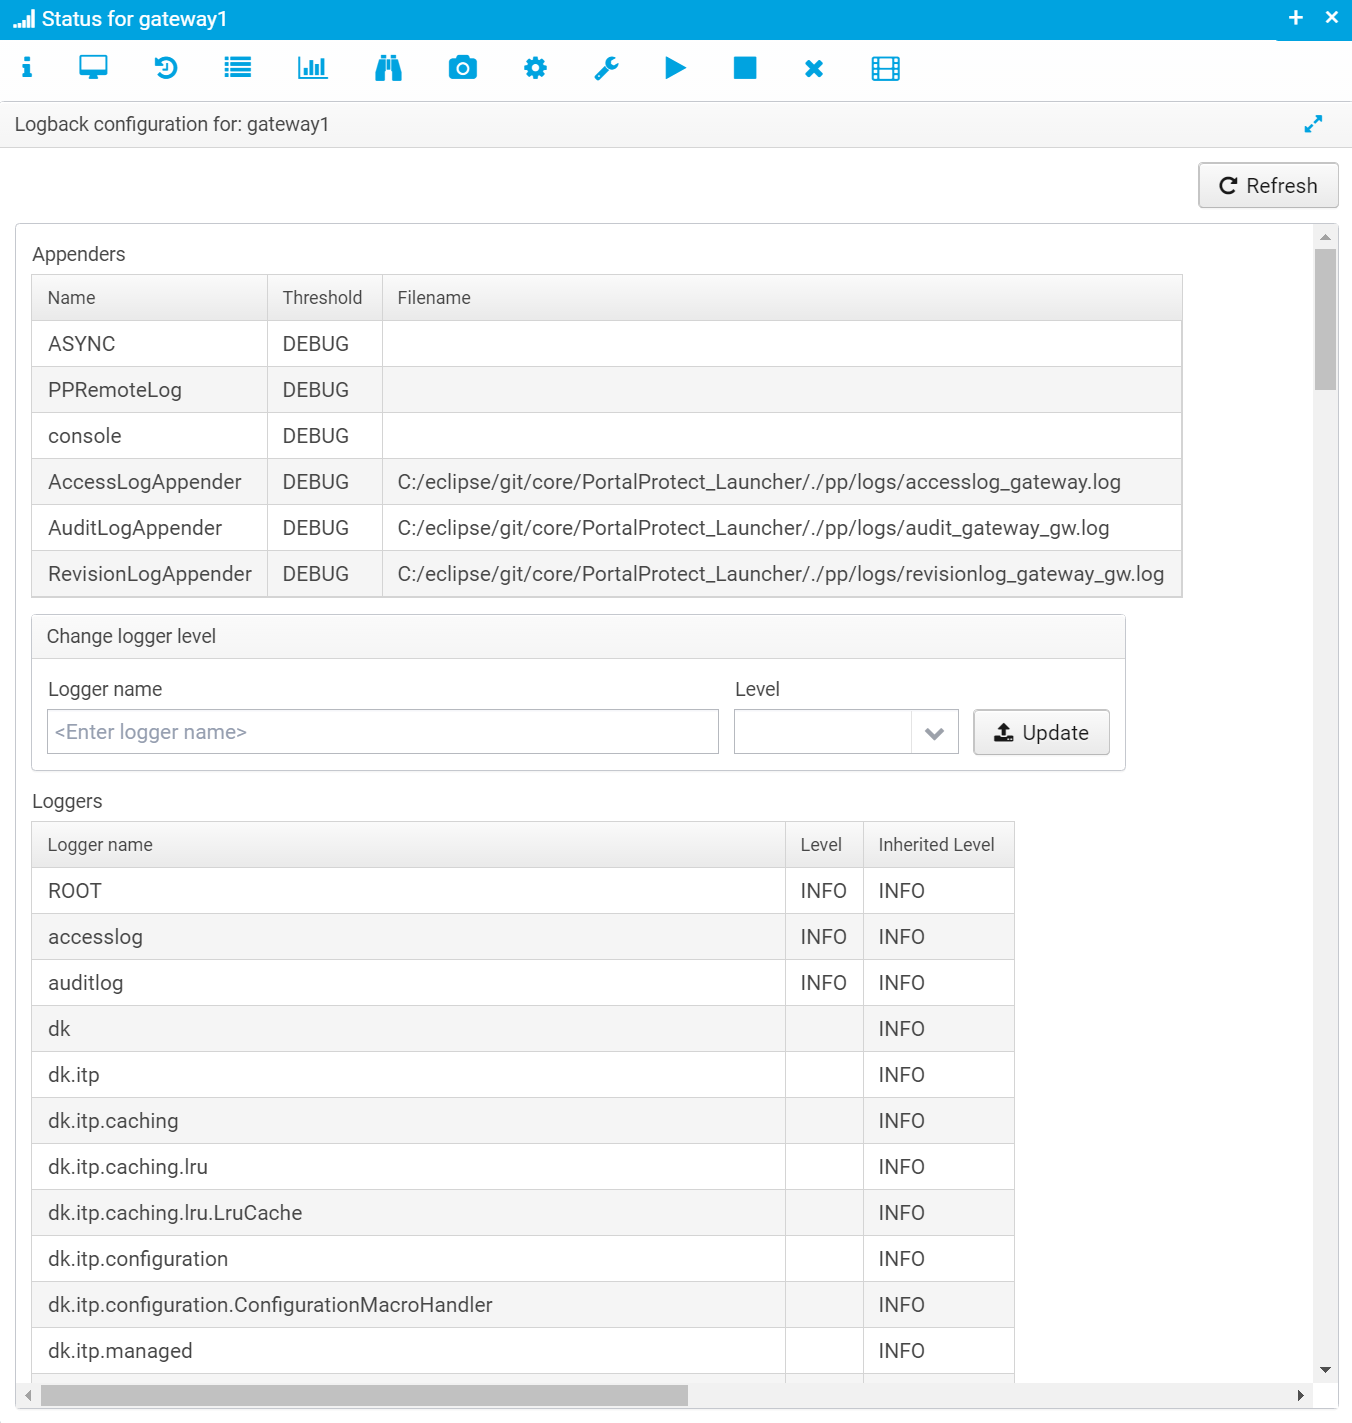
Select an entry, or write the name of an appender, selects its new level and click Update and it will take effect immediately - note that this is only happening on runtime and will not be saved across restarts.
Log4j Configuration
If you use log4j instead of logback, you can change logger settings here for this.
The screen looks like the logback one above, or like this when log4j is not used so there are no log appenders to display:

Note that on rare occurrences, the same application can use both logback and log4j - that is the reason we have both available instead of attempting to detect which one is used only showing that.
If you use java-util-logging (JUL) in your applications, we recommend using logback and install its jul-slf4j bridge which transfers all JUL log events to SLF4J / Logback.
Gateway Tracing
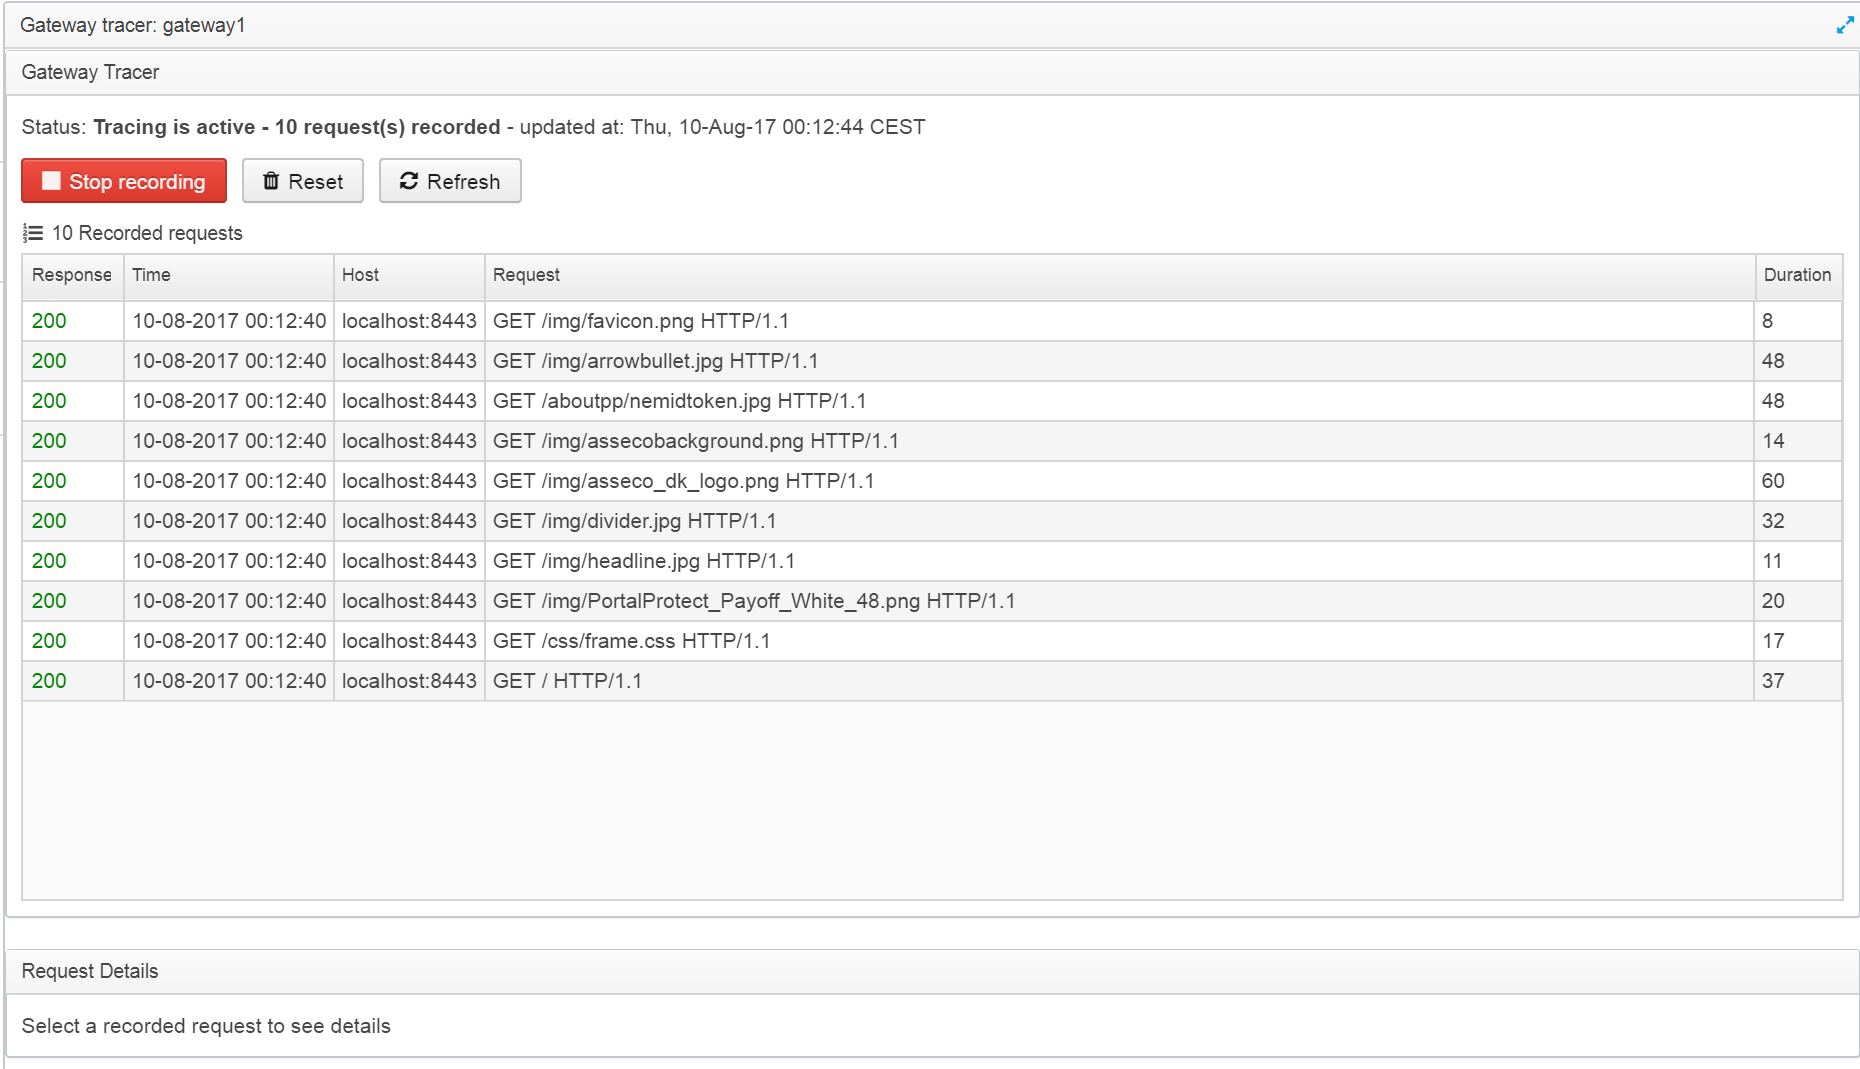
Refer to Gateway Tracing for details.
Gateway Usage
This diagram provides an overview of the configured gateway locations, and which pipelines and destinations they are using. You can also see the number of requests and average response time for the last hour.
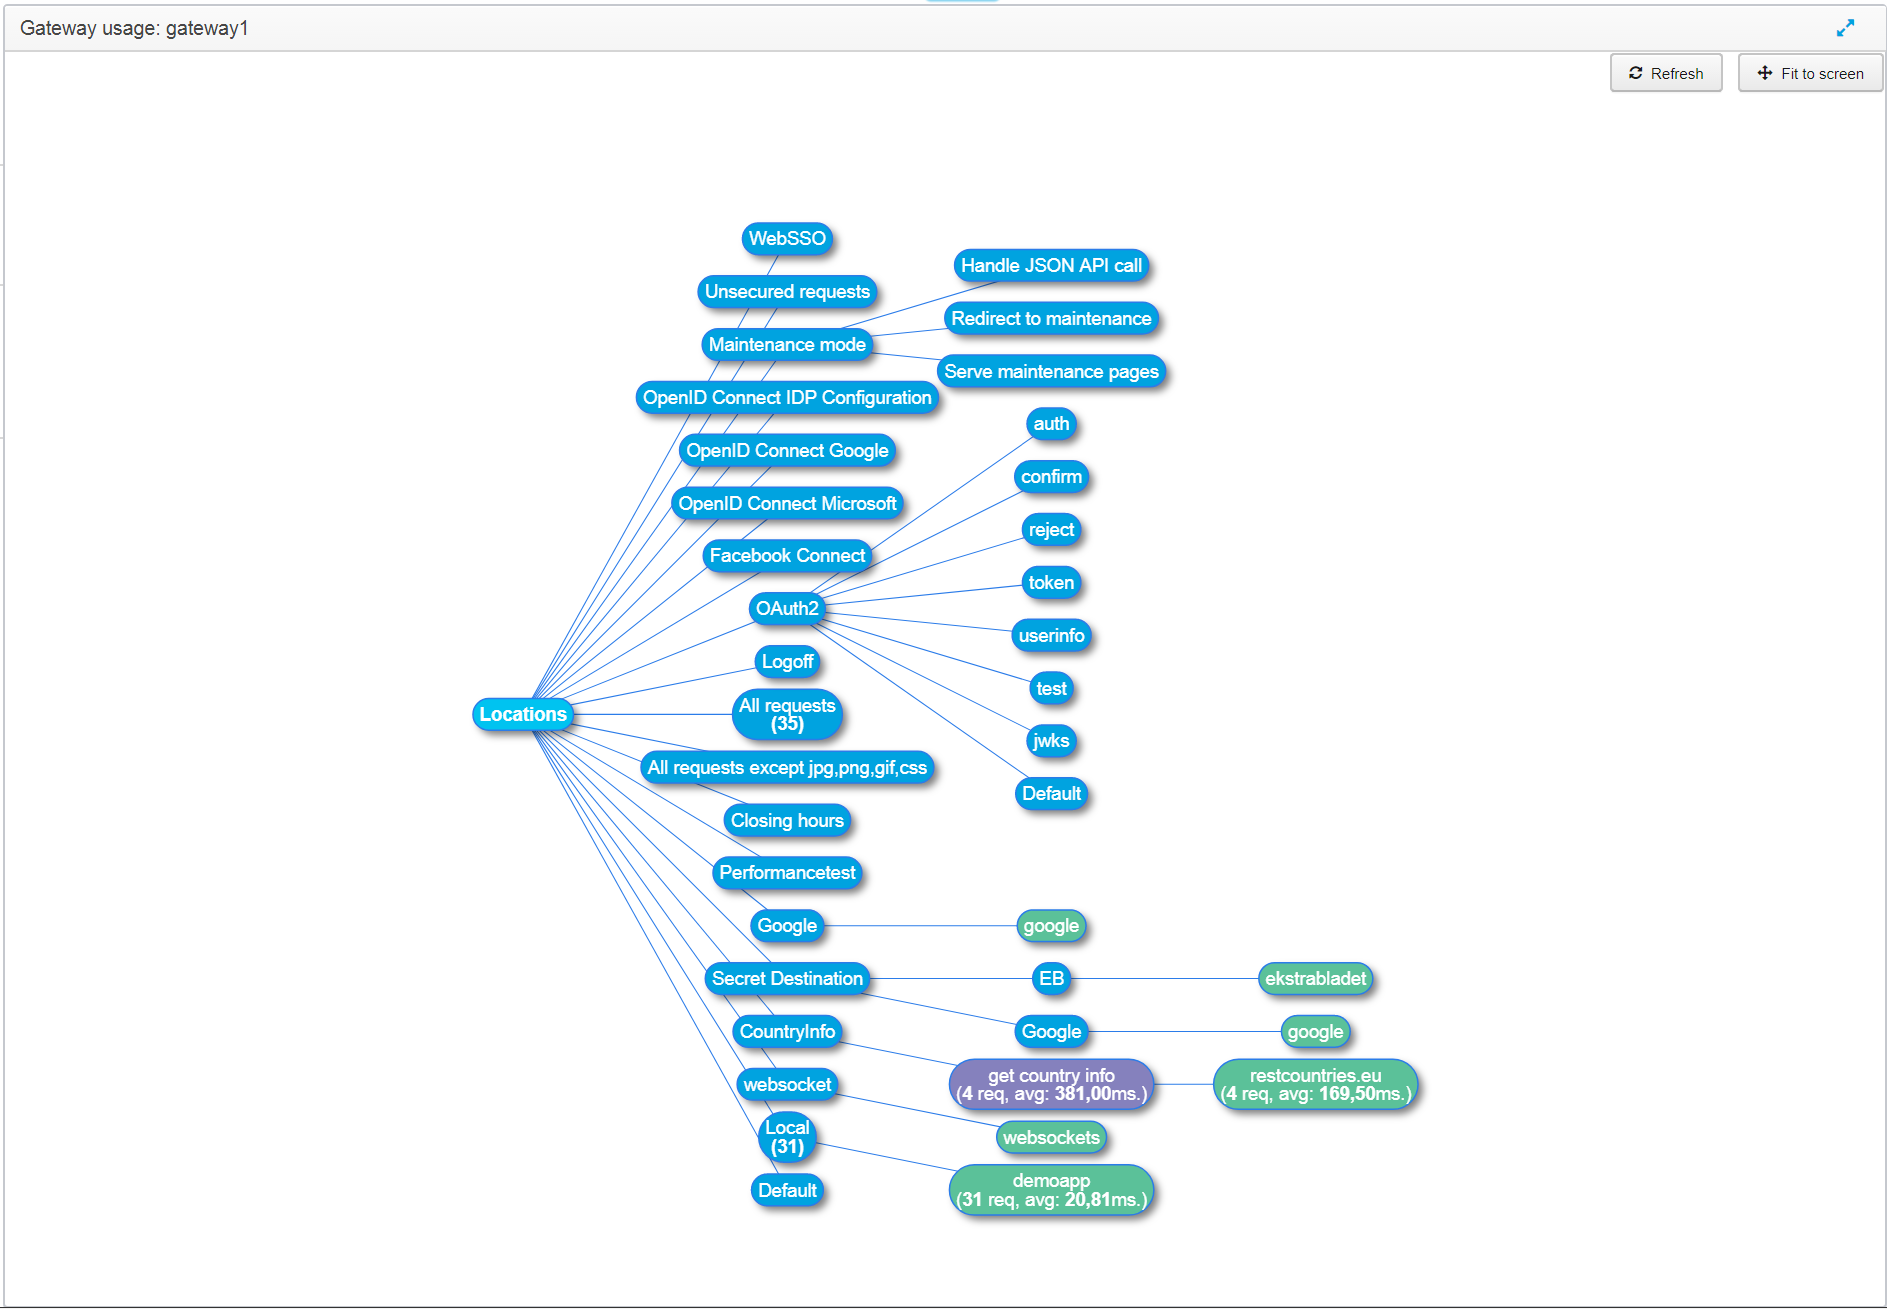
Note that you can also add this diagram to a dashboard, where it displays data for the period chosen for the dashboard - see Dashboards for details.